Connectome Workbench#
A tutorial for accessing and visualizing the 7T HCP Retinotopy Dataset on Connectome Workbench.
This tutorial was created by Fernanda L. Ribeiro.
Email: fernanda.ribeiro@uq.edu.au
Github: @felenitaribeiro
Twitter: @NandaRibeiro93
This tutorial documents how to use Connectome Workbench on neurodesk for visualizing the 7T HCP Retinotopy Dataset.
Download data#
First, make sure you register for the Human Connectome Project Open Access Data: https://www.humanconnectome.org/study/hcp-young-adult/data-use-terms
Register to the BALSA database: https://balsa.wustl.edu/.
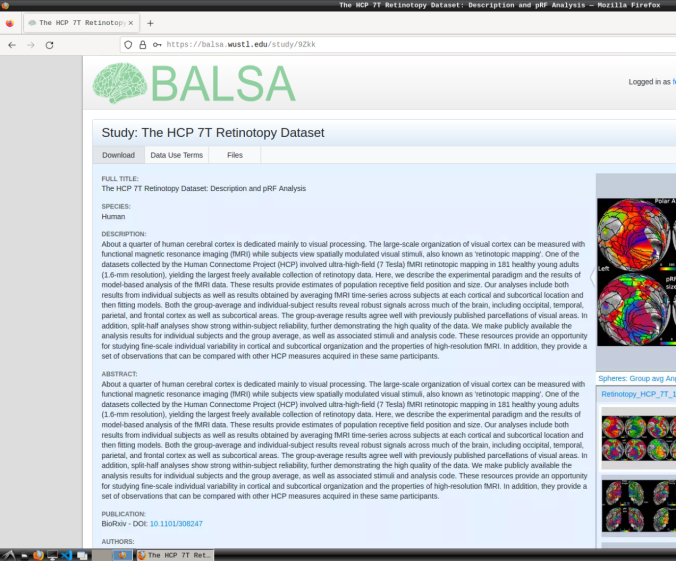
Login and download the scene files containing the retinotopic maps available at: https://balsa.wustl.edu/study/9Zkk.
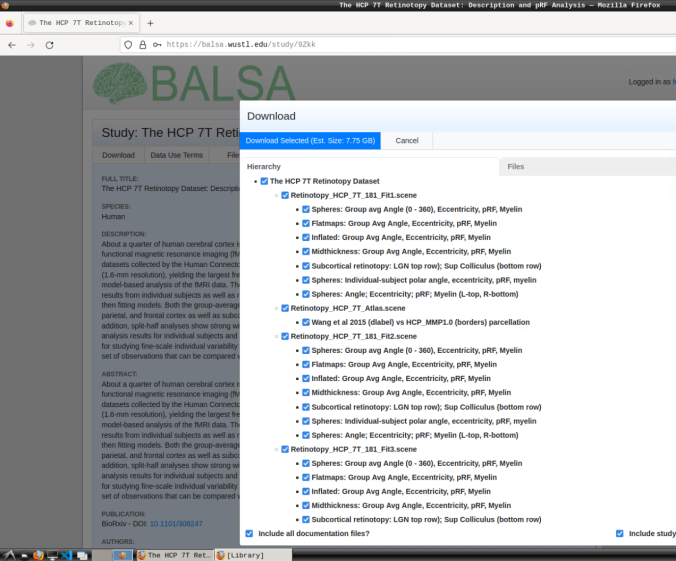
These files include preprocessed collated data from 181 participants, including retinotopic, curvature, midthickness, and myelin maps.
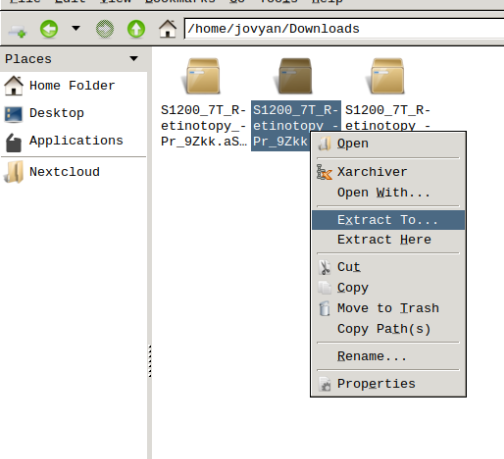
Finally, unzip the S1200_7T_Retinotopy_9Zkk.zip file.
Visualizing scene files#
Using Connectome Workbench, you can load “.scene” files and visualize all individuals’ retinotopic maps. To do so, follow the next steps:
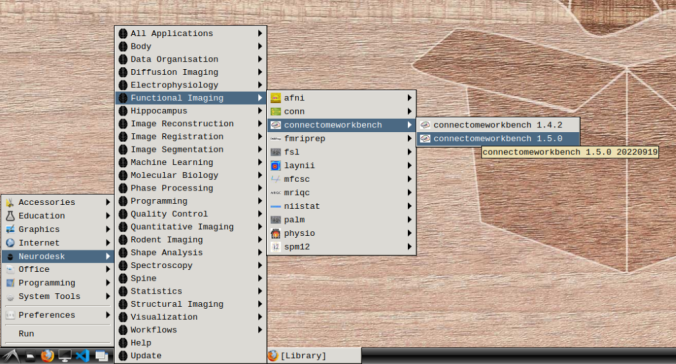
In the application menu, navigate to Neurodesk → functional imaging → connectomeworkbench → connectomeworkbench 1.5.0
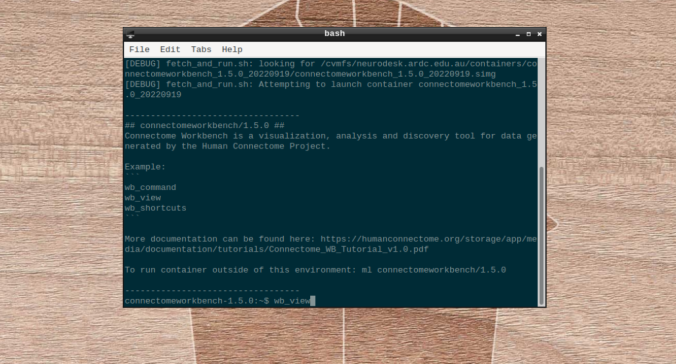
On the terminal shell that pops up, type in:
wb_view
Click on “Open Other”
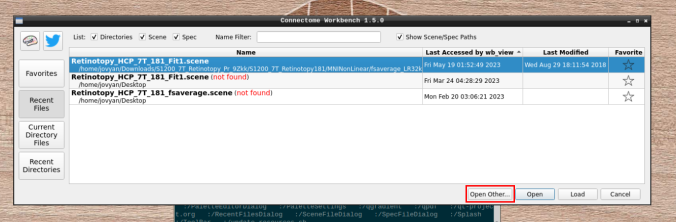
and search for a scene file
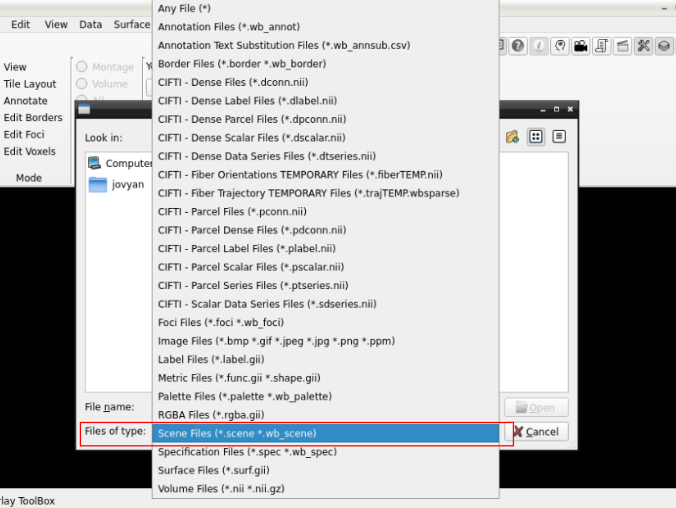
in the path where your data is
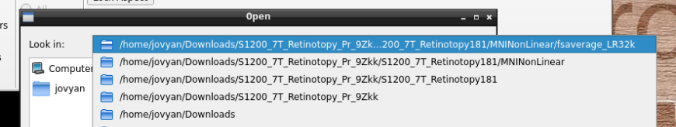
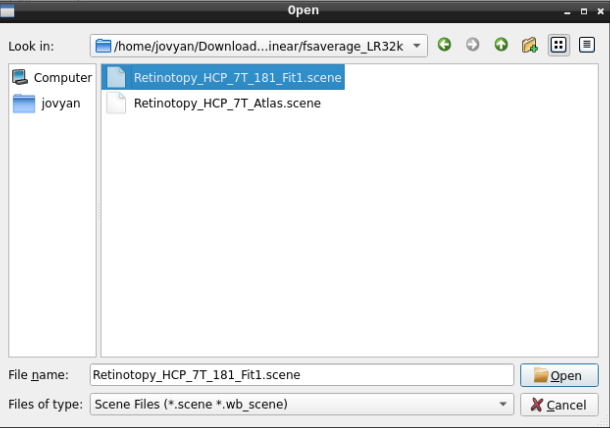
Finally, select the desired file and open it:
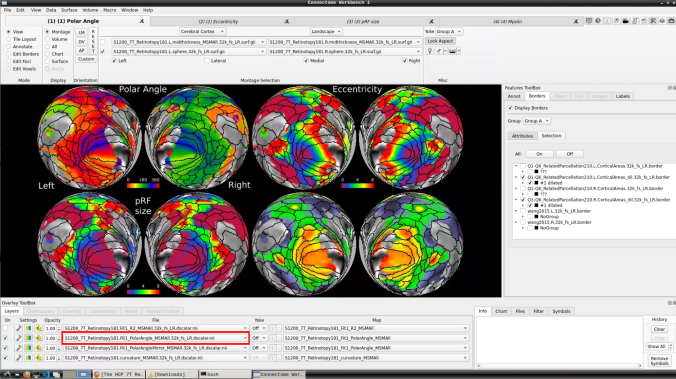
On the ‘Scenes’ window that will pop up, select the first option.
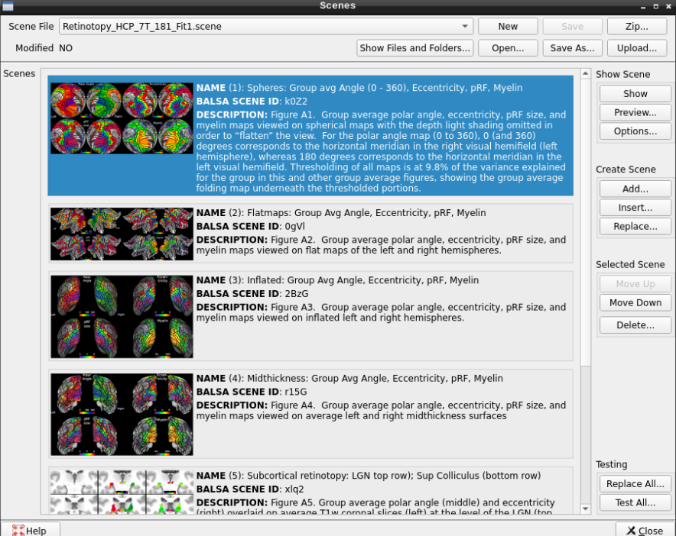
The default images are the average maps.
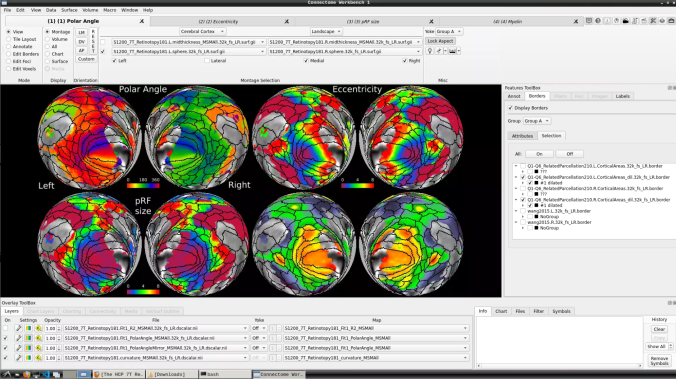
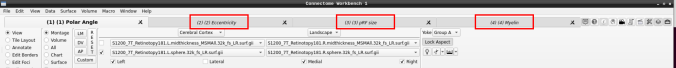
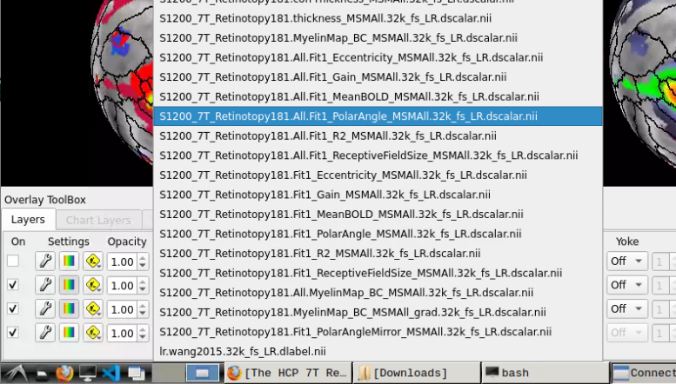
To change the displayed images for an individual’s data instead, click on the first ticked dropdown menu
and select “S1200_7T_Retinotopy181.All.Fit1_PolarAngle_MSMALL.32k_fs_LR.dscalar.nii”:
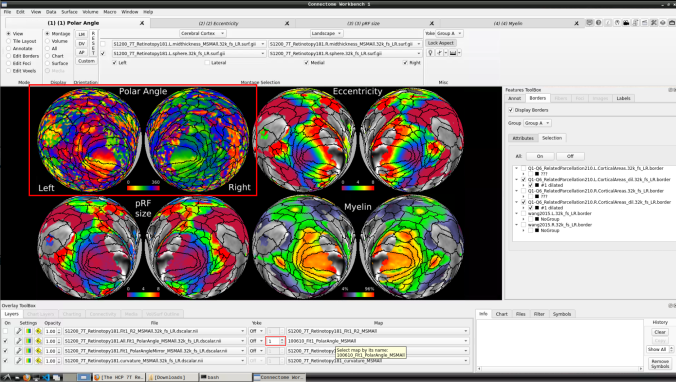
Now, you should be able to select specific maps from the dropdown menu on the right. For example, here we have the first individual polar angle map (top left):
Now we have the fifth:
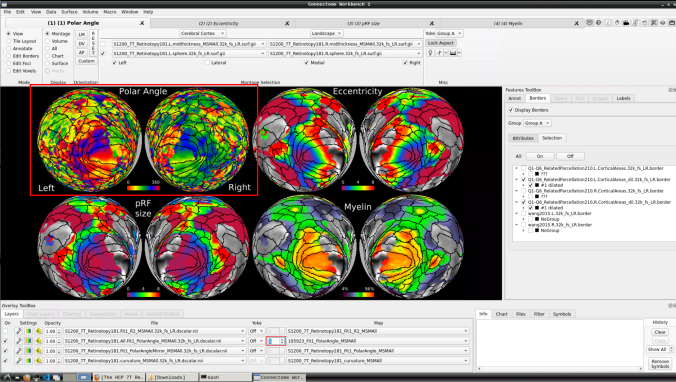
You can do the same for the other functional maps by navigating through the tabs at the top.