Susceptibility-Weighted Imaging (SWI)#
Author: Steffen Bollmann, Michèle Masson-Trottier
The University of Queensland
Date: 16/03/2026
License:
Purpose#
Susceptibility-weighted imaging (SWI) is an MRI technique that exploits differences in magnetic susceptibility between tissues to generate contrast. It is particularly useful for visualising venous vasculature, microbleeds, calcifications, and iron deposits in the brain.
This tutorial demonstrates how to:
Download a demo MRI dataset containing magnitude and phase images
Use the CLEAR-SWI Julia package within Neurodesk to compute SWI maps
Generate a minimum intensity projection (mIP) for enhanced vein visualisation
Inspect the results in an image viewer
Learning Objectives
By the end of this tutorial you will be able to:
Understand what SWI is and why it is clinically relevant
Run the CLEAR-SWI pipeline on magnitude and phase data
Create and interpret minimum intensity projections
Citation and Resources#
Tools used in this workflow#
- CLEAR-SWI
Eckstein, K., et al. (2023). CLEAR-SWI — Coil-combined Low-artifact Enhanced Arbitrary Resolution SWI. Zeitschrift für Medizinische Physik. https://doi.org/10.1016/j.zemedi.2023.01.001
Educational resources#
Prerequisites#
Before you begin
Make sure you have access to a running Neurodesk instance. See Getting Set Up with Neurodesk for instructions.
A running Neurodesk environment
Familiarity with basic terminal commands
No additional software installation required — CLEAR-SWI is pre-installed in Neurodesk
Load software tools and download demo data#
First, we install osfclient to download the demo dataset from the Open Science Framework, then fetch and unzip the BIDS-formatted data. We use the same demo dataset as the Unwrapping tutorial.
To do so, open a Neurodesktop session, launch a terminal and run the following commands.
Tip
To paste in Neurodesktop, best to use the right click on your mouse!
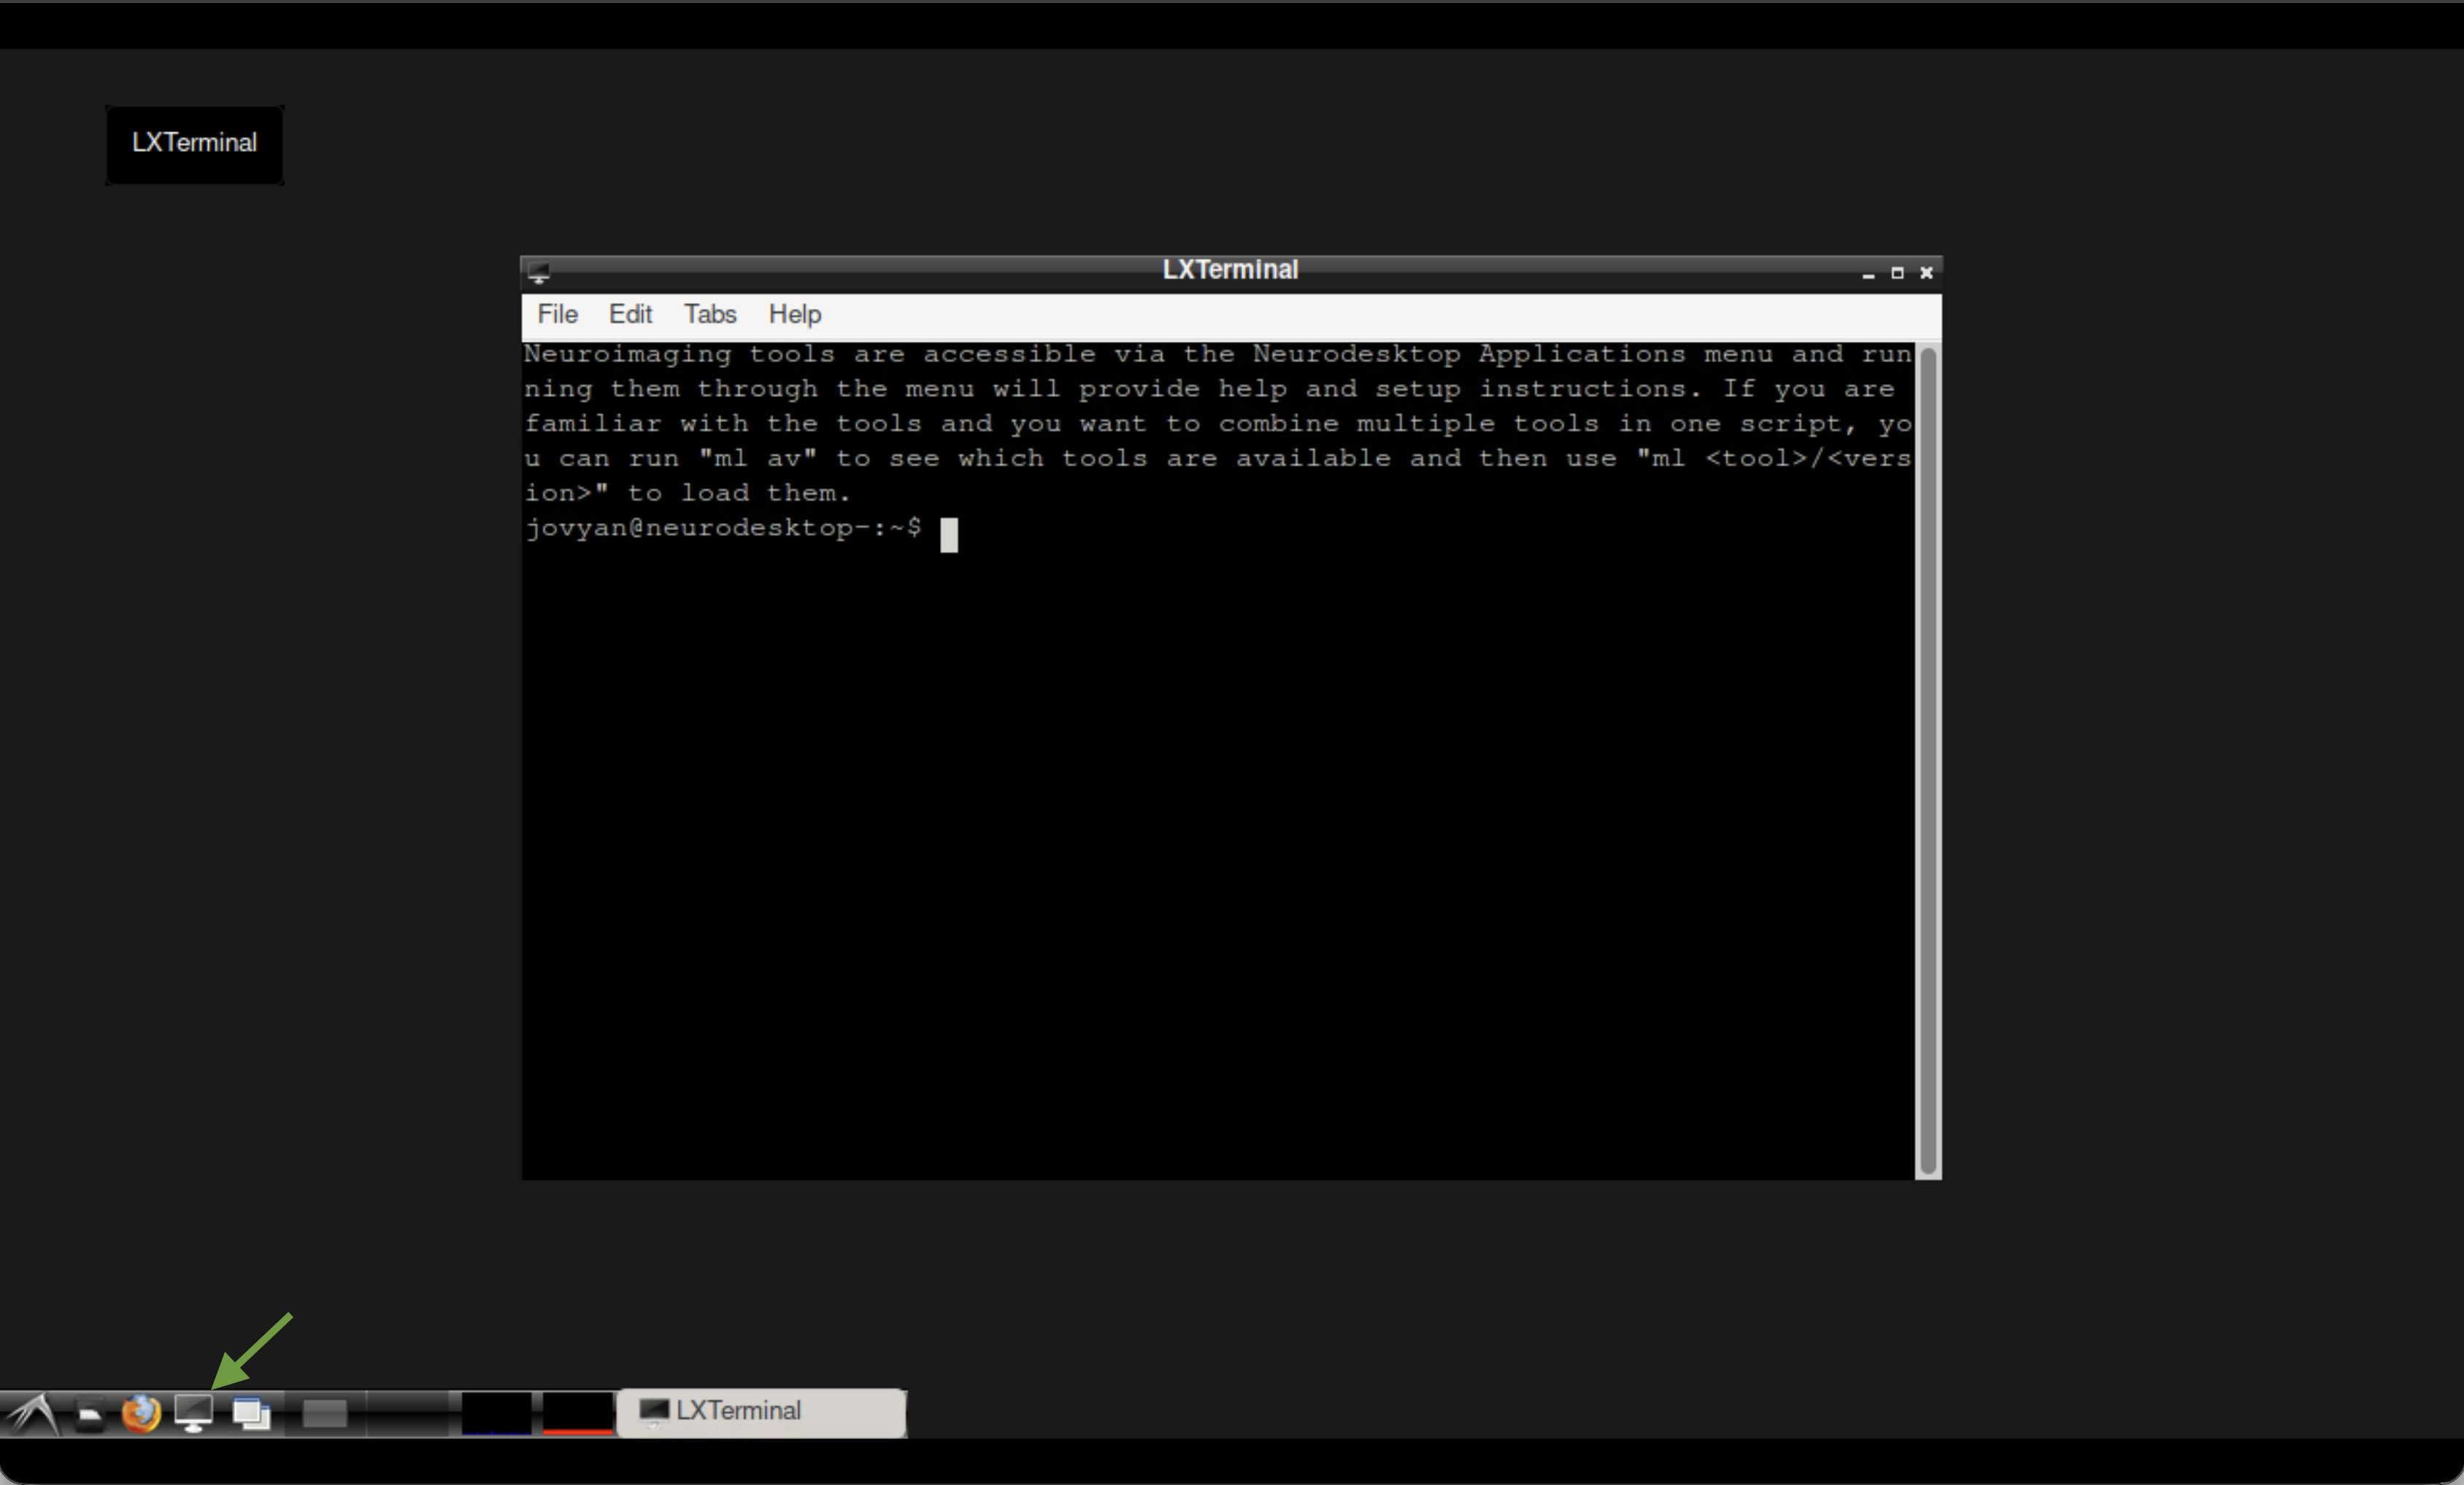 The terminal in Neurodesktop.
pip install osfclient
cd ~/neurodesktop-storage/
osf -p ru43c fetch -f 01_bids.zip ~/neurodesktop-storage/swi-demo/01_bids.zip

unzip -o ~/neurodesktop-storage/swi-demo/01_bids.zip -d ~/neurodesktop-storage/swi-demo/
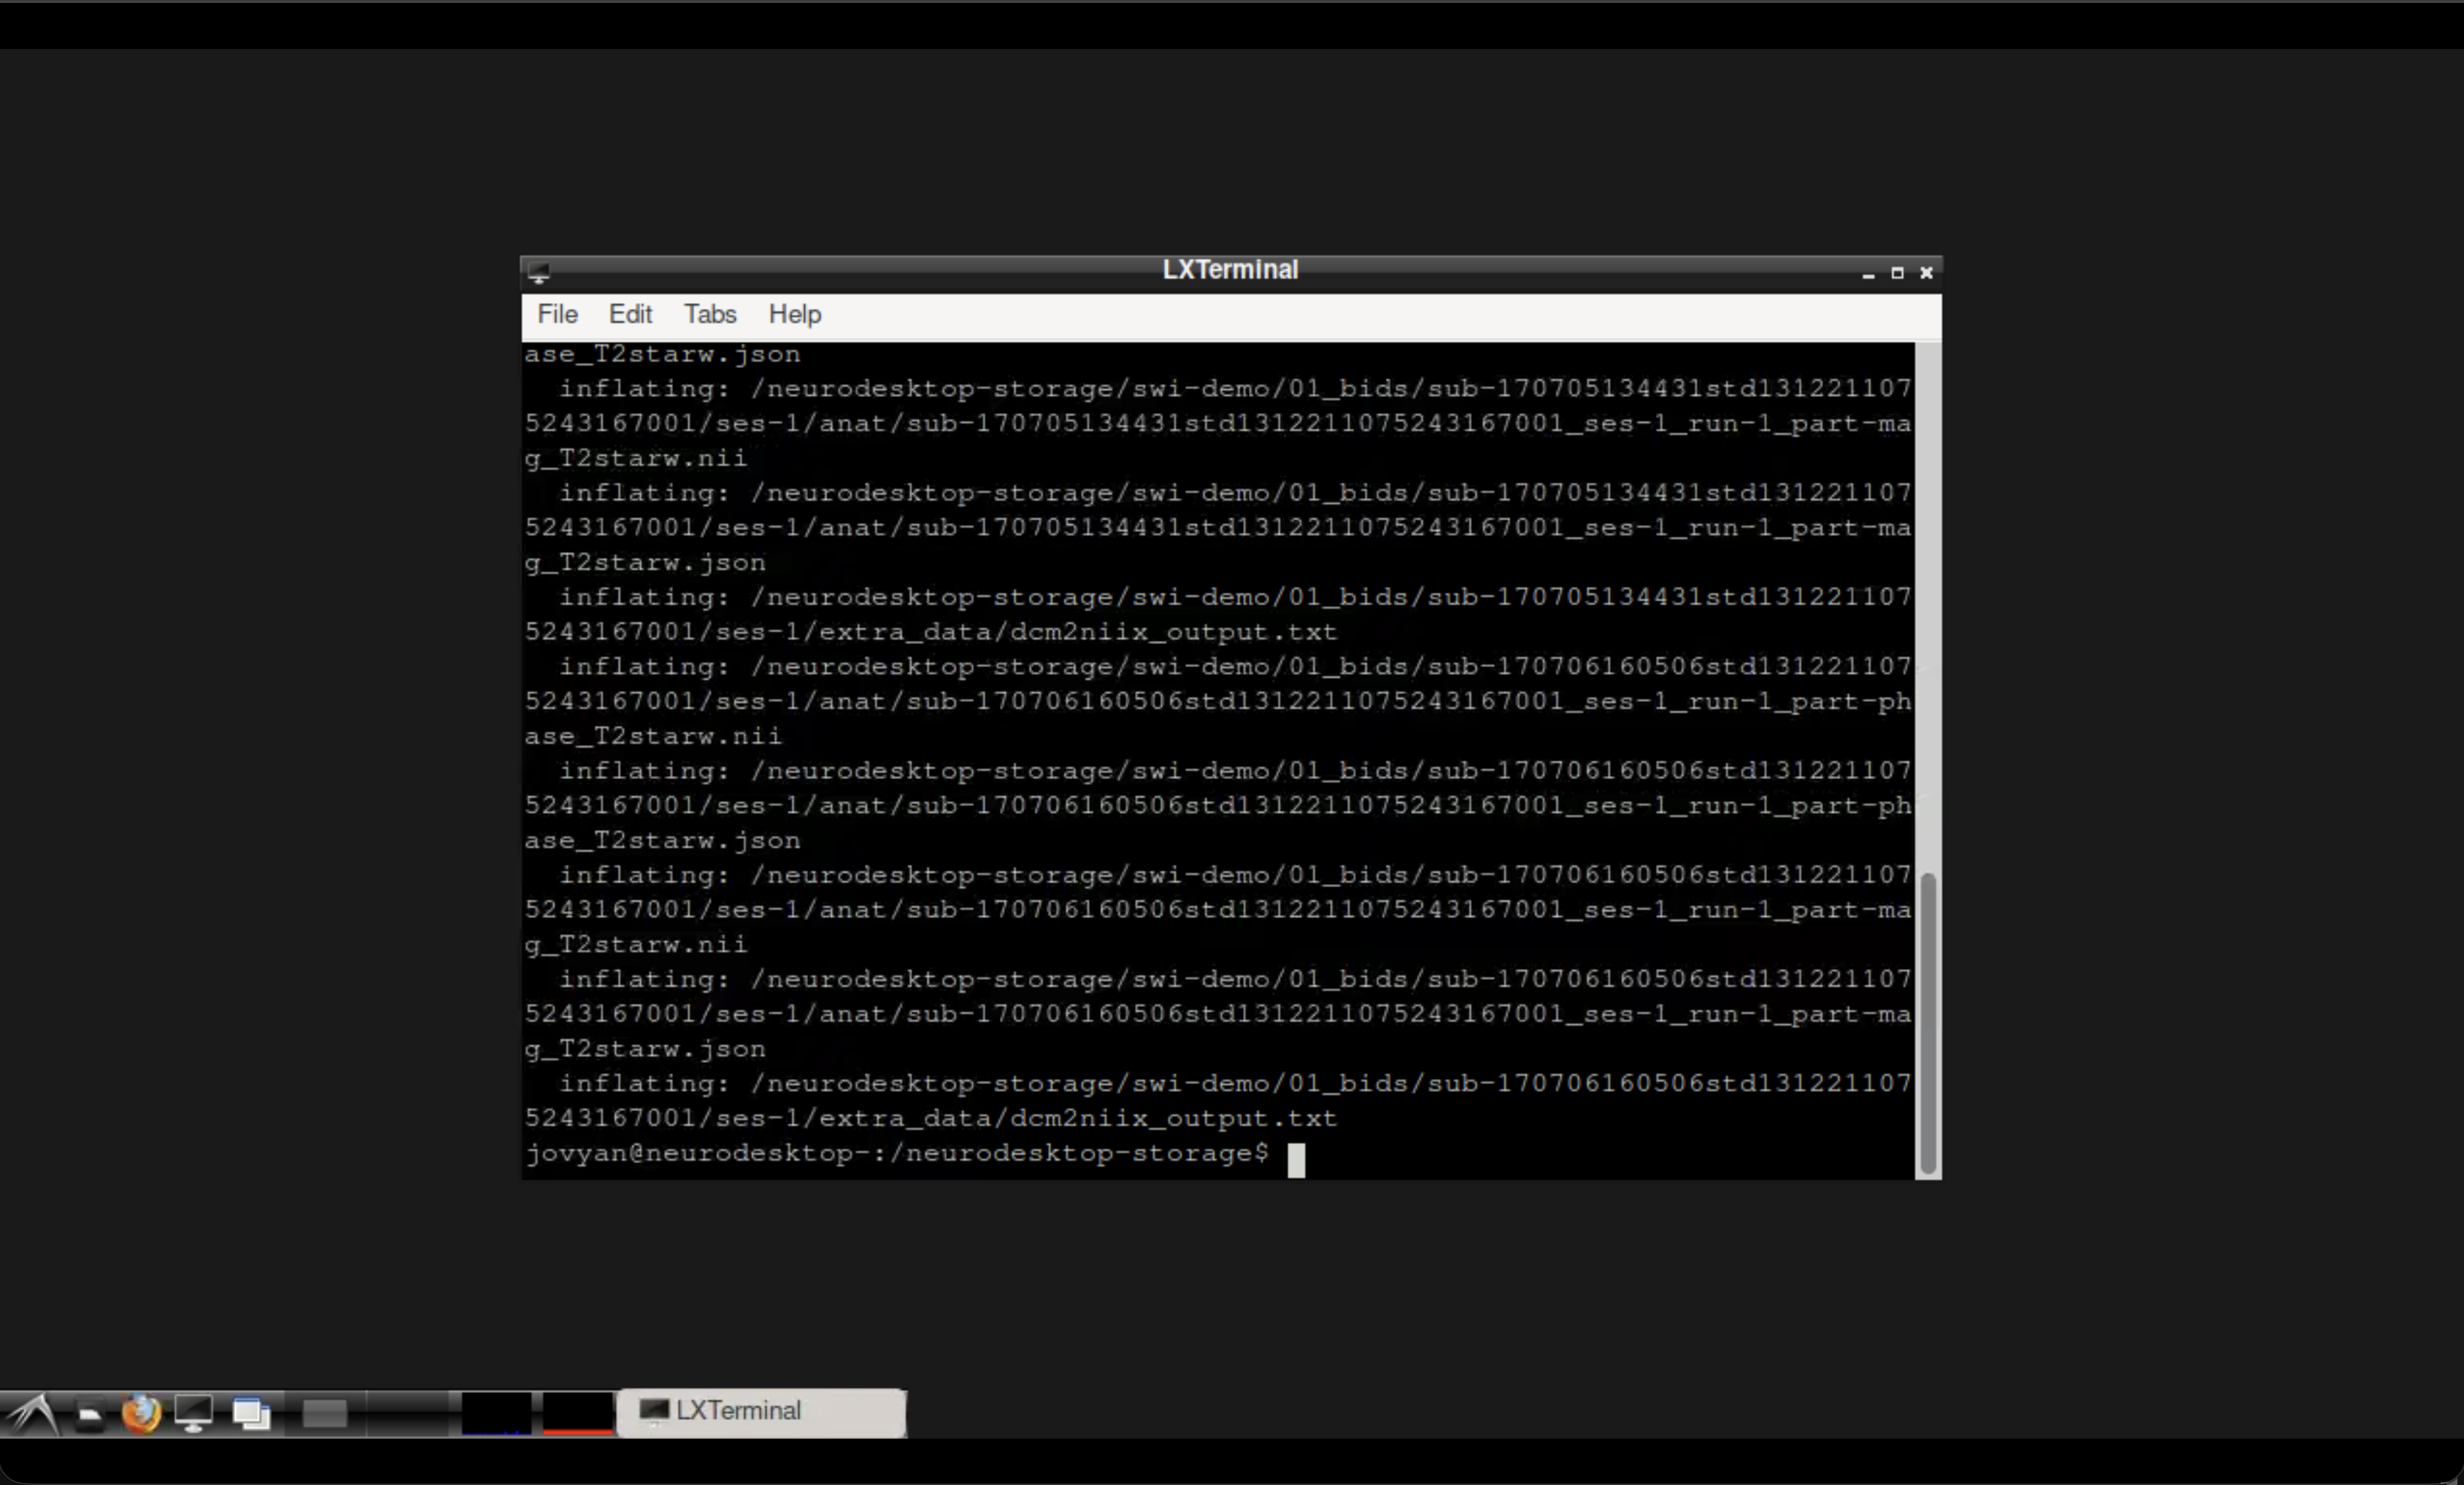 The Neurodesktop terminal outputs after running the command.
You may wish to confirm the download was successful. You can locate the files in your neurodesktop-storage folder using the file manager. You will see the swi-demo folder containing a zipped and unzipped 01_bids folder.
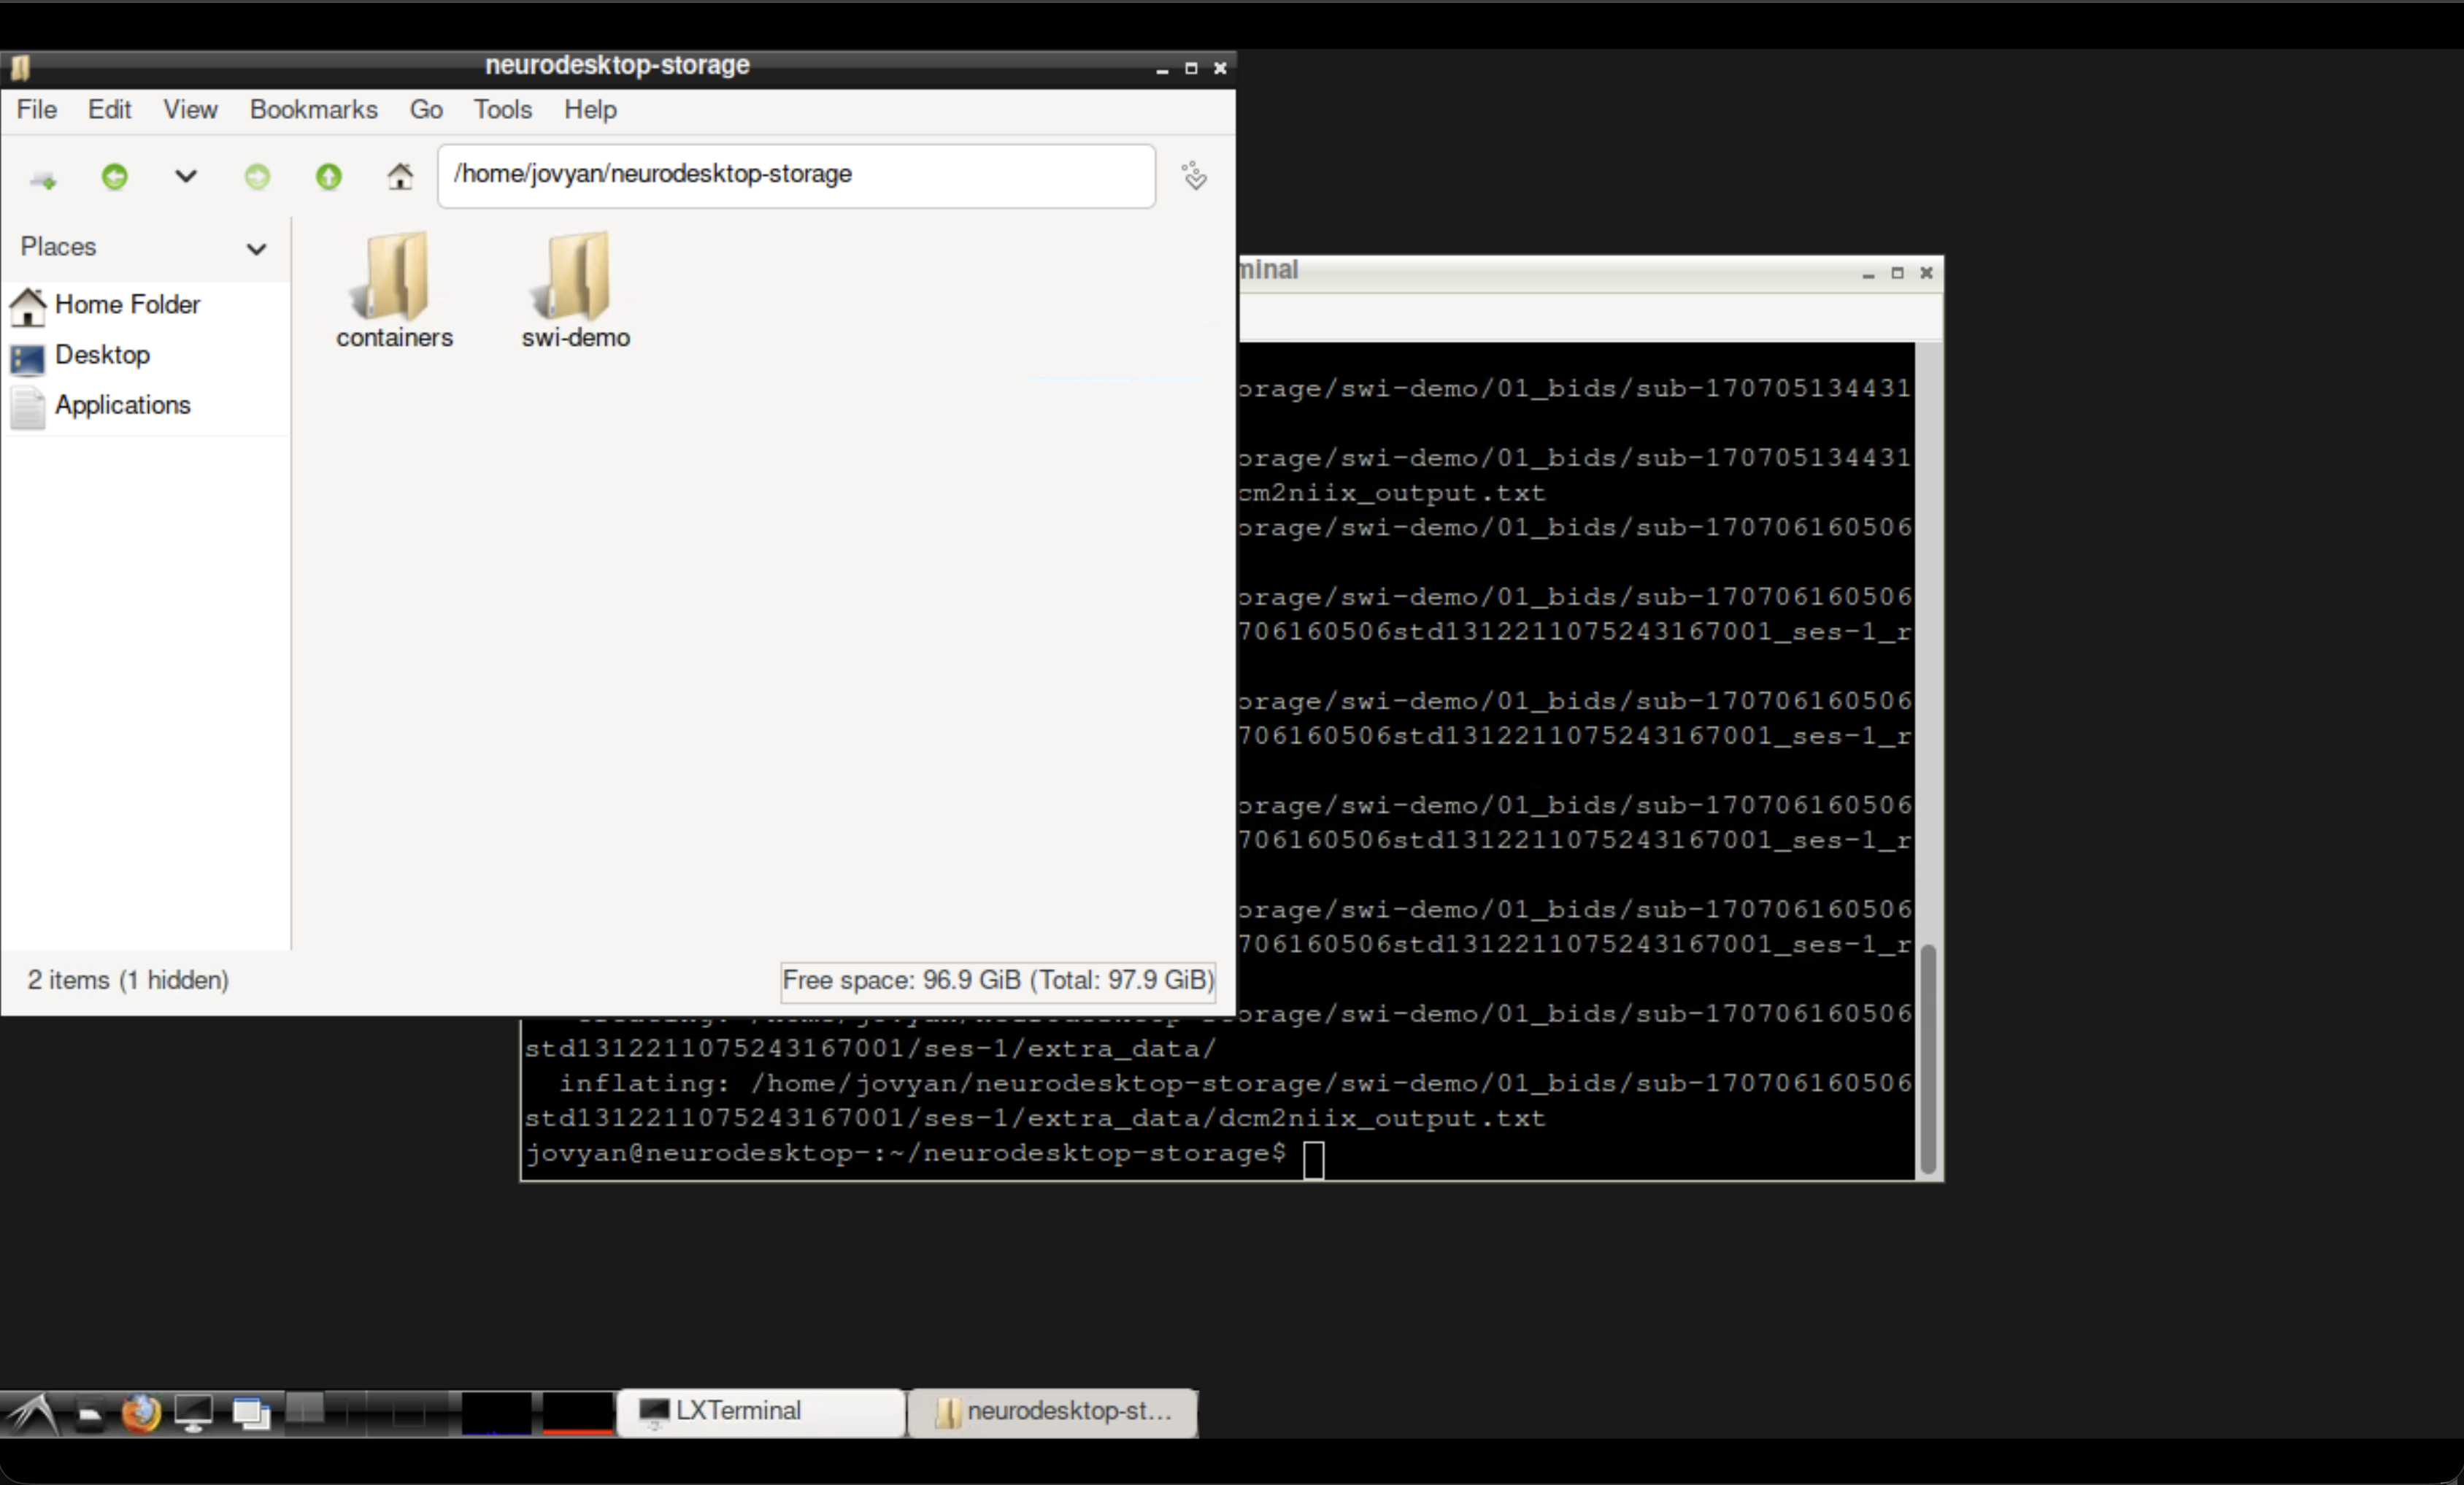 The Neurodesktop file manager showing the downloaded data.
Run CLEAR-SWI#
Write a Julia script that will perform three steps:
Read the magnitude and phase NIfTI files
Compute the SWI volume using
calculateSWIGenerate a minimum intensity projection (mIP) using
createMIP
Note
The echo time (TEs) must match your acquisition. For this single-echo demo dataset, TEs = [20] (in ms).
Using the command
nano ~/neurodesktop-storage/clearswi.jl
create a file called clearswi.jl with the following contents :
using CLEARSWI

TEs = [20]
nifti_folder = joinpath(homedir(), "neurodesktop-storage/swi-demo/01_bids/sub-170705134431std1312211075243167001/ses-1/anat")
magfile = joinpath(nifti_folder, "sub-170705134431std1312211075243167001_ses-1_run-1_part-mag_T2starw.nii")
phasefile = joinpath(nifti_folder, "sub-170705134431std1312211075243167001_ses-1_run-1_part-phase_T2starw.nii")

println("Loading magnitude and phase data...")
mag = readmag(magfile);
phase = readphase(phasefile);
data = Data(mag, phase, mag.header, TEs);

println("Computing SWI...")
swi = calculateSWI(data);

println("Creating minimum intensity projection...")
mip = createMIP(swi);

outdir = joinpath(homedir(), "neurodesktop-storage/swi-demo")
println("Saving outputs...")
savenii(swi, joinpath(outdir, "swi.nii"); header=mag.header)
savenii(mip, joinpath(outdir, "mip.nii"); header=mag.header)

println("Done! Output saved to ~/neurodesktop-storage/swi-demo/")
Save the file using Ctrl+X (confirm by hitting Y followed by Enter).
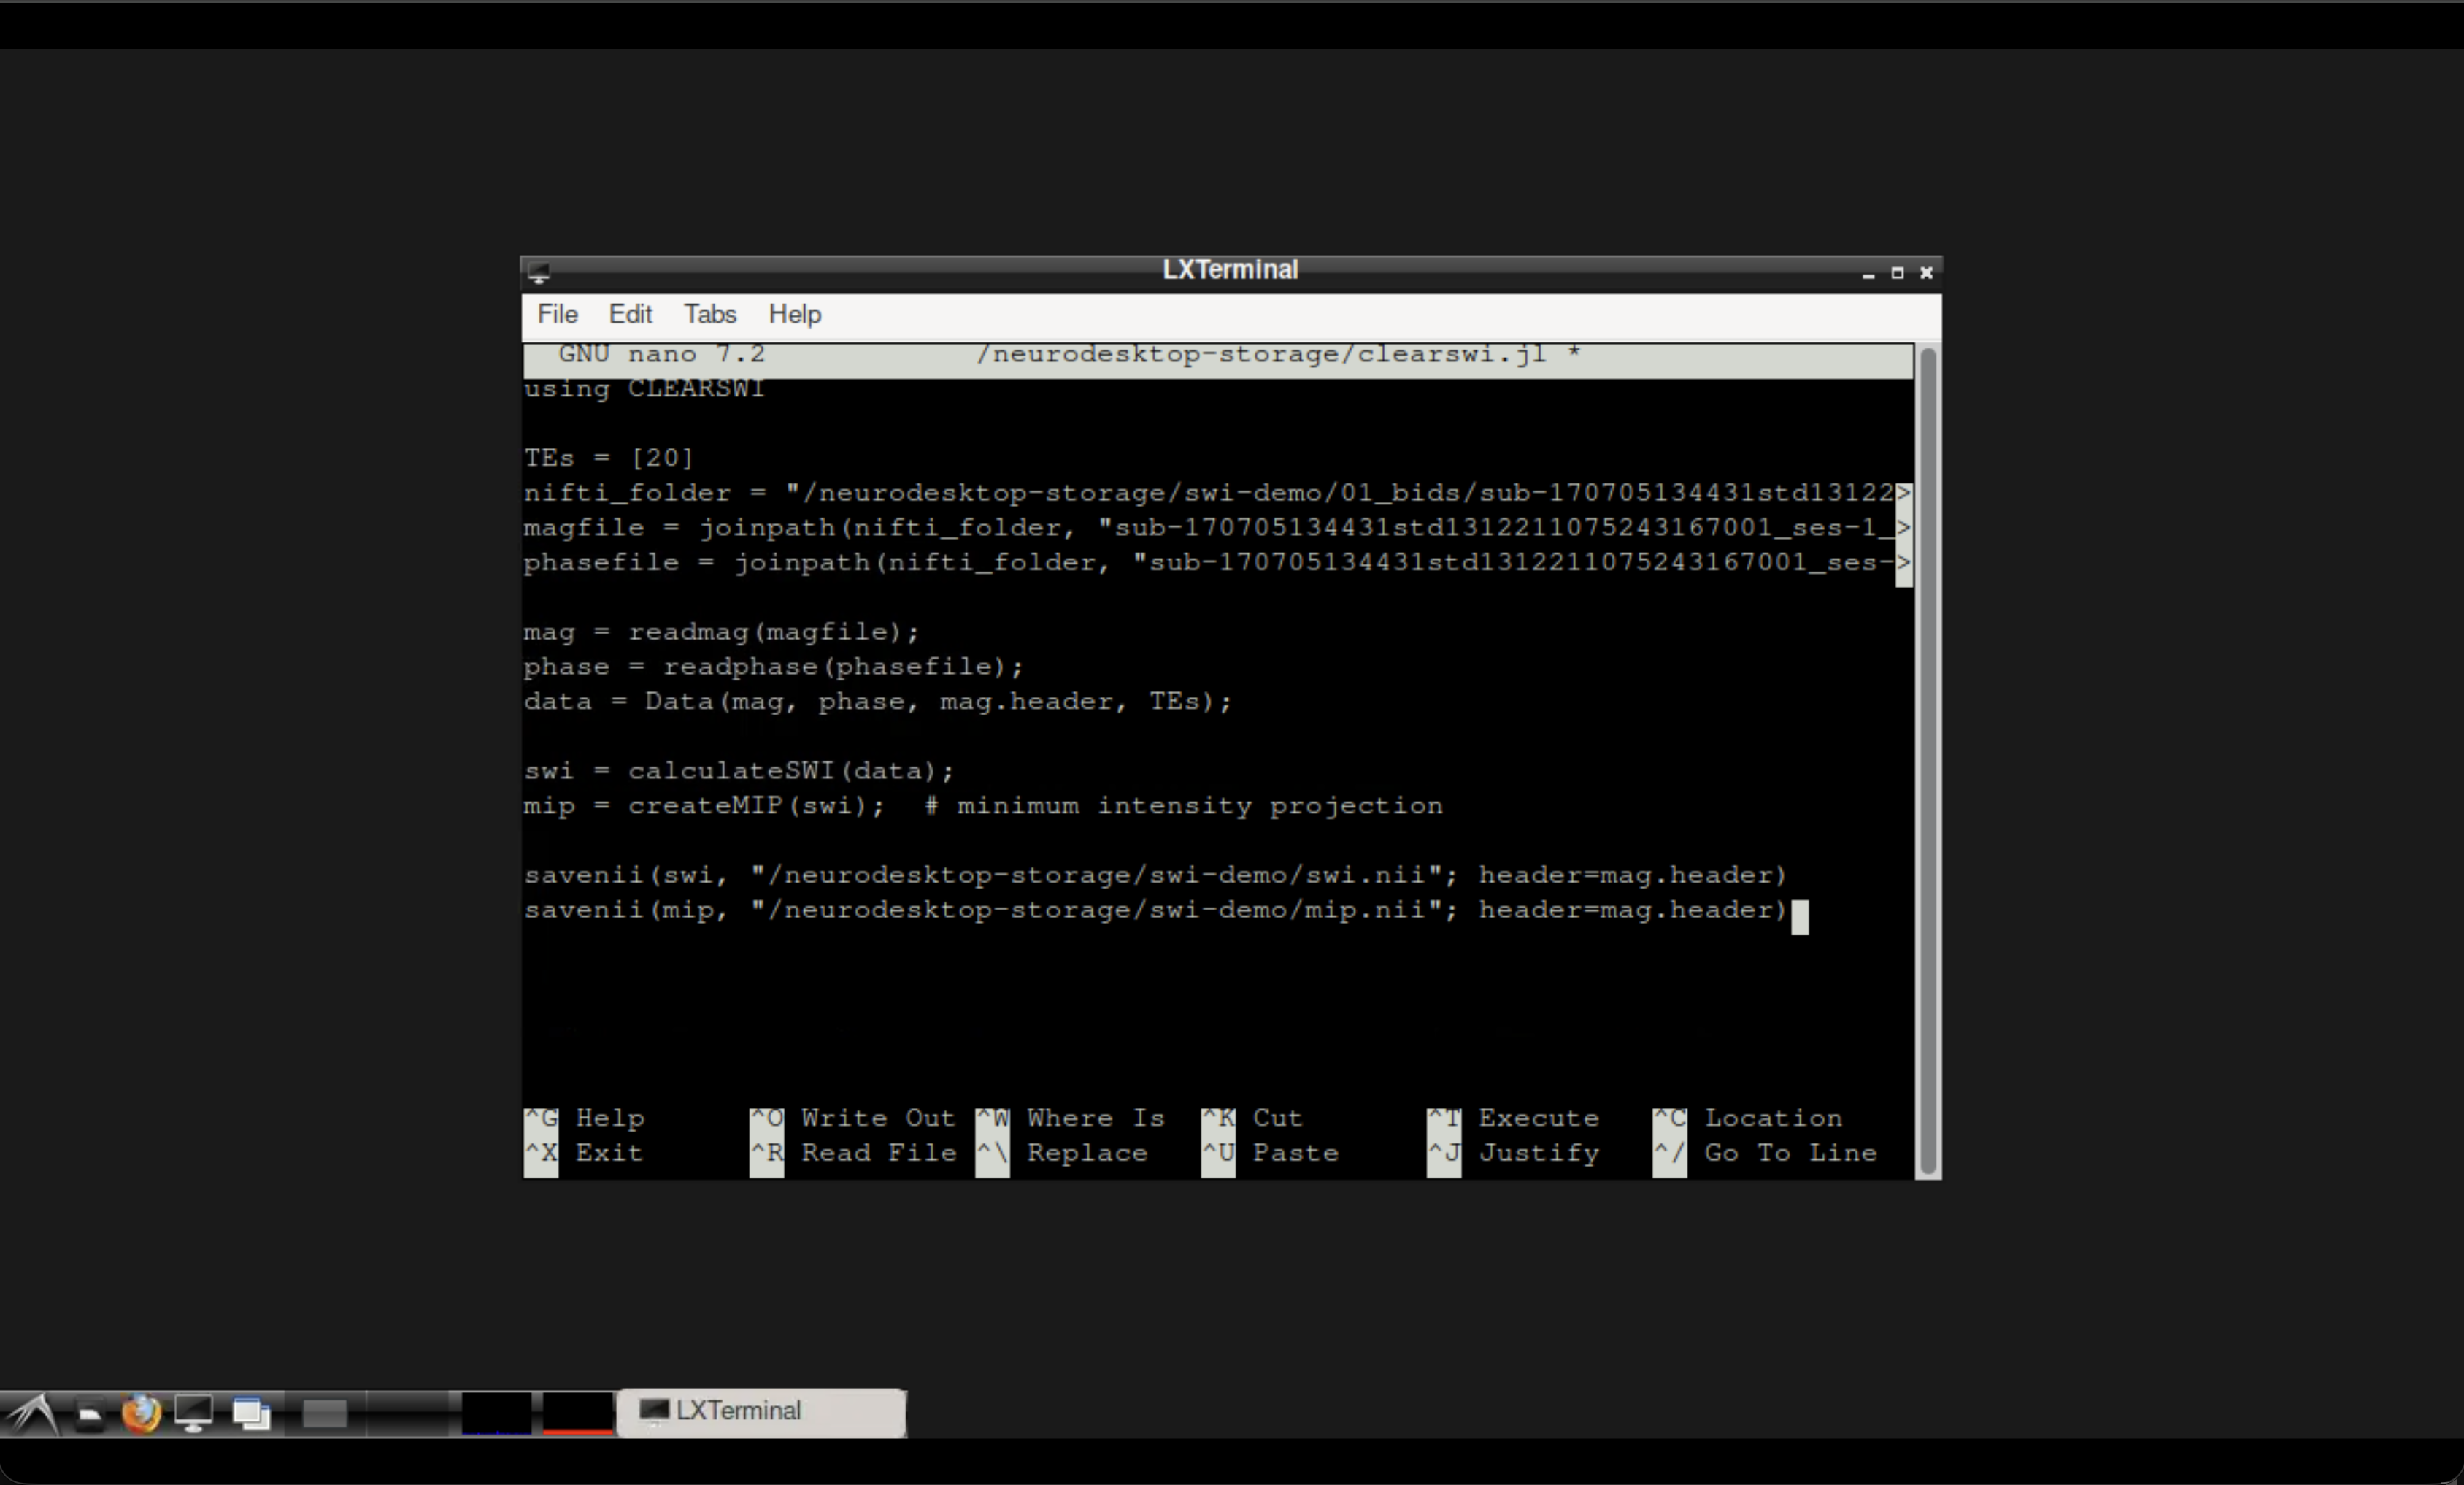 The Neurodesktop terminal with the Julia script.
Open the CLEAR-SWI tool from the Neurodesk application menu.
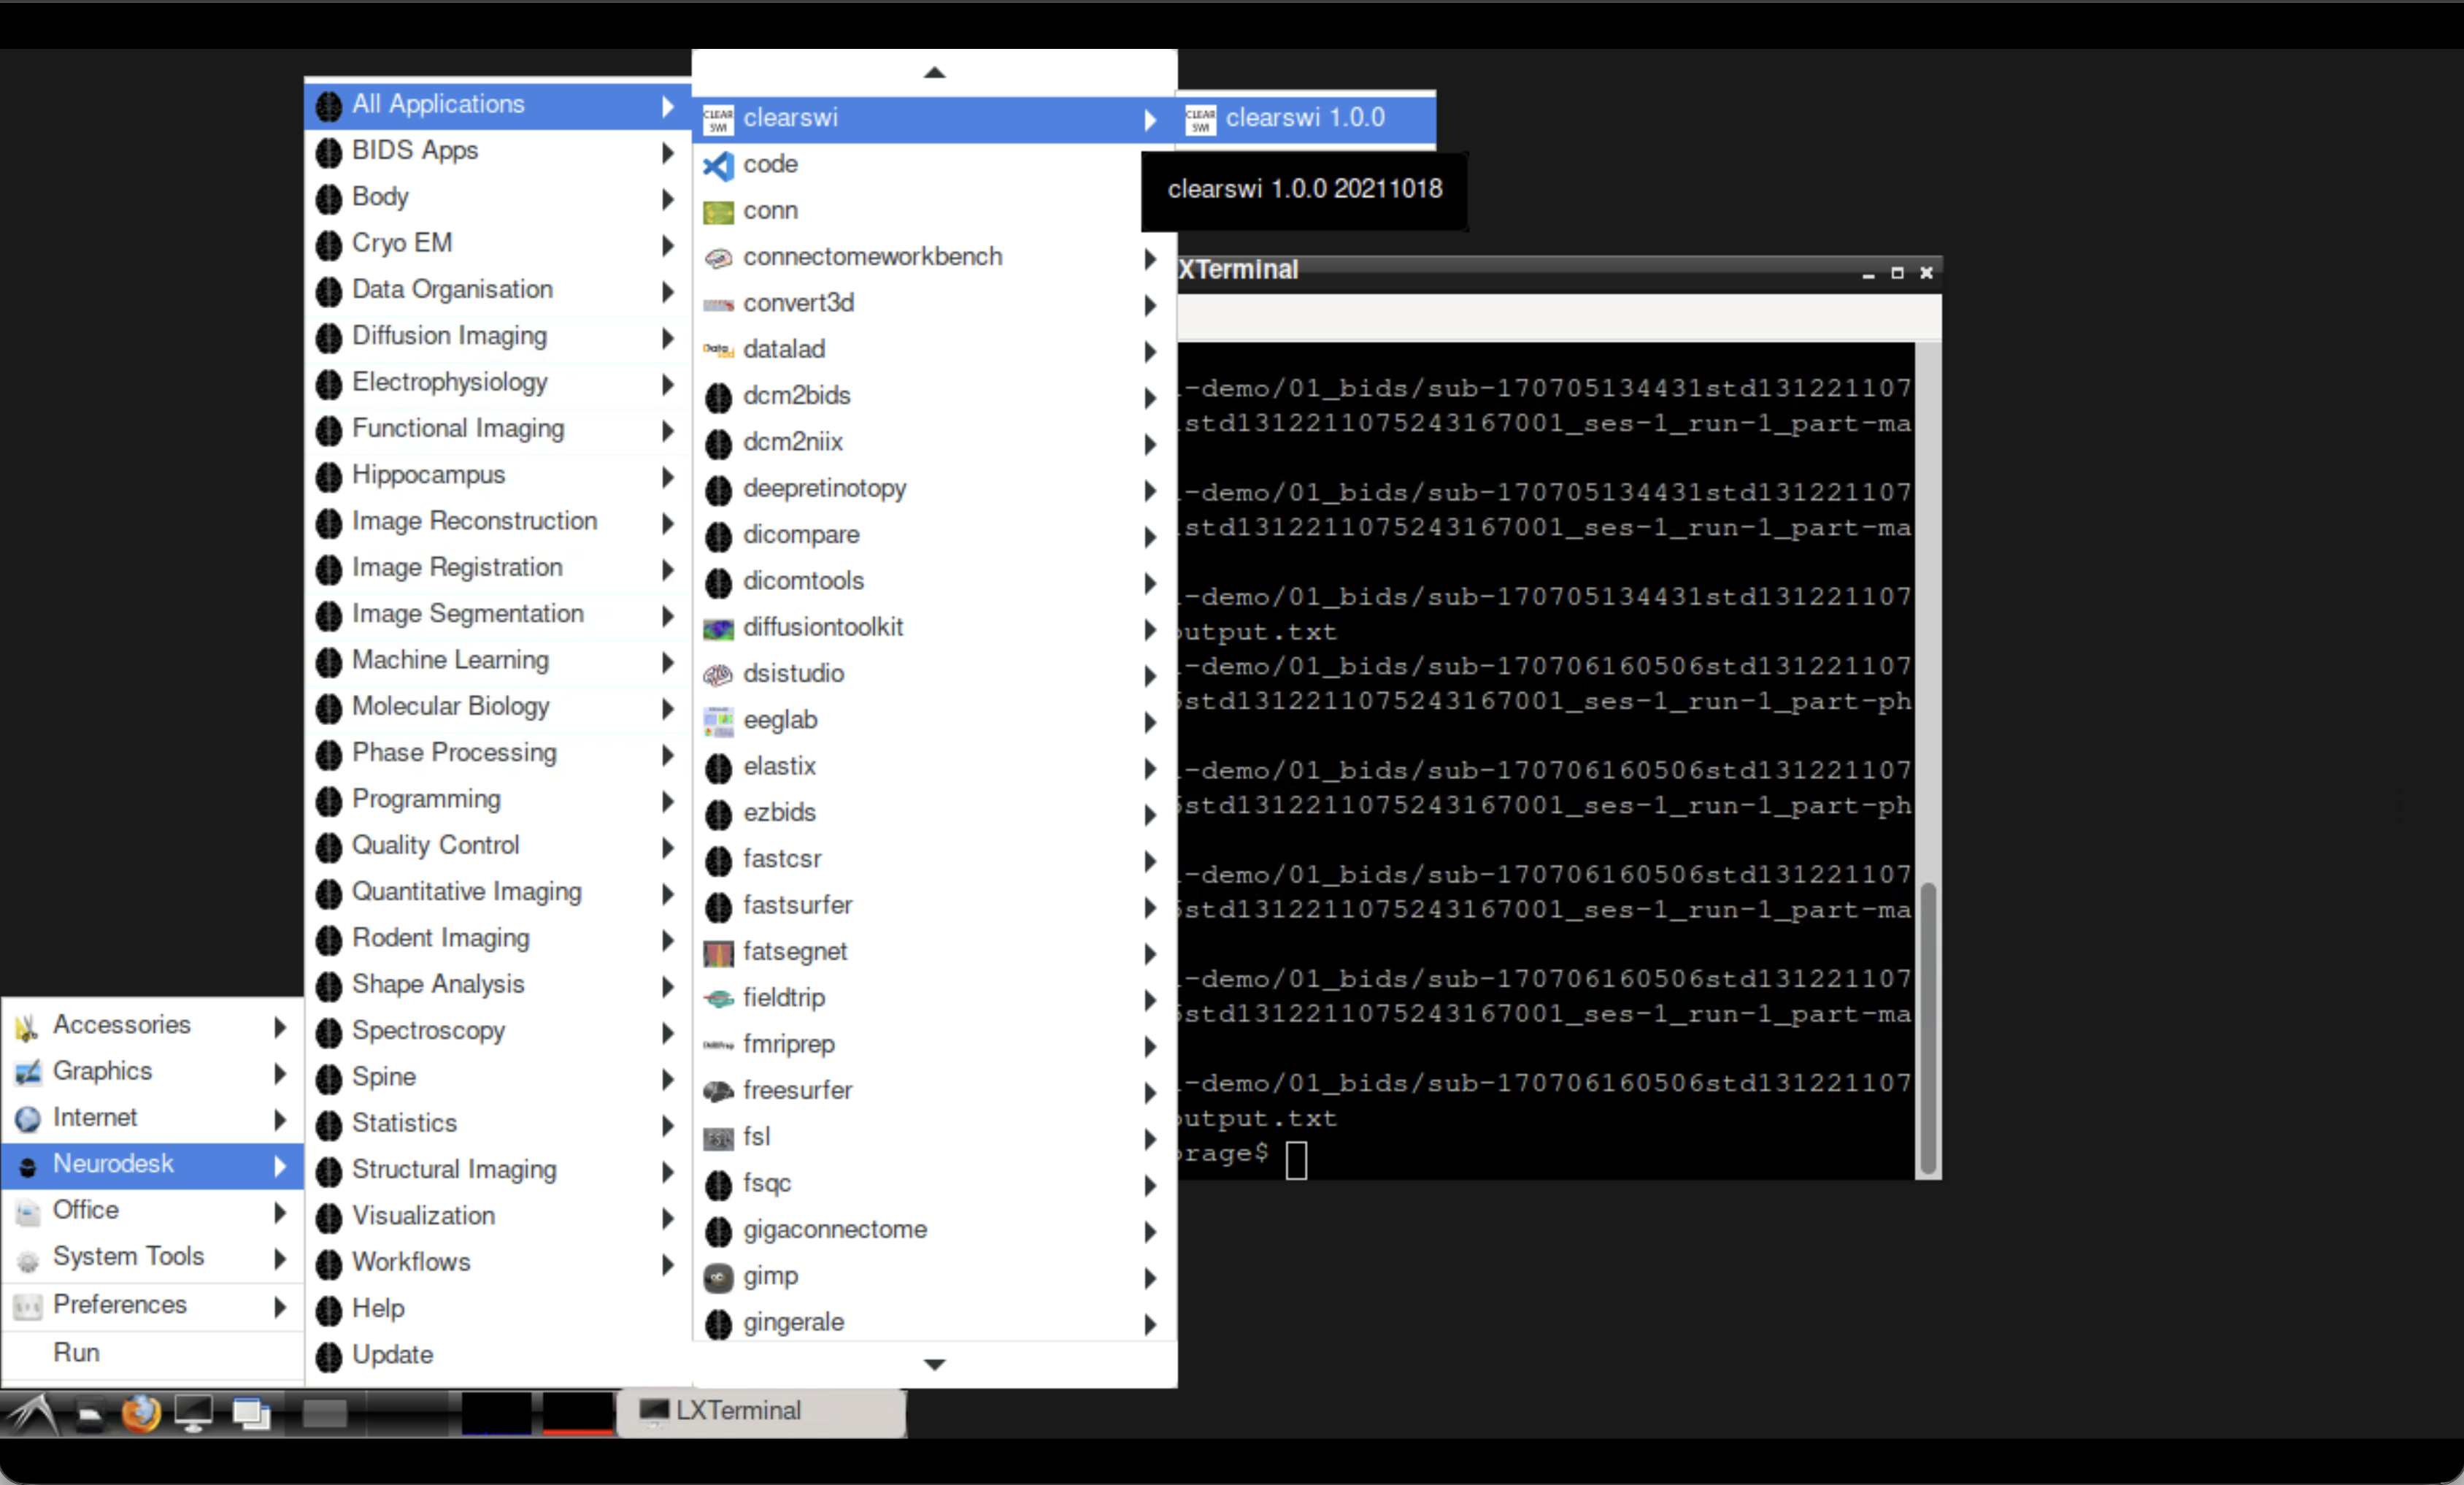 Opening CLEAR-SWI in Neurodesktop.
Then run your newly written file from the CLEAR-SWI container terminal:
cd ~/neurodesktop-storage/
julia clearswi.jl
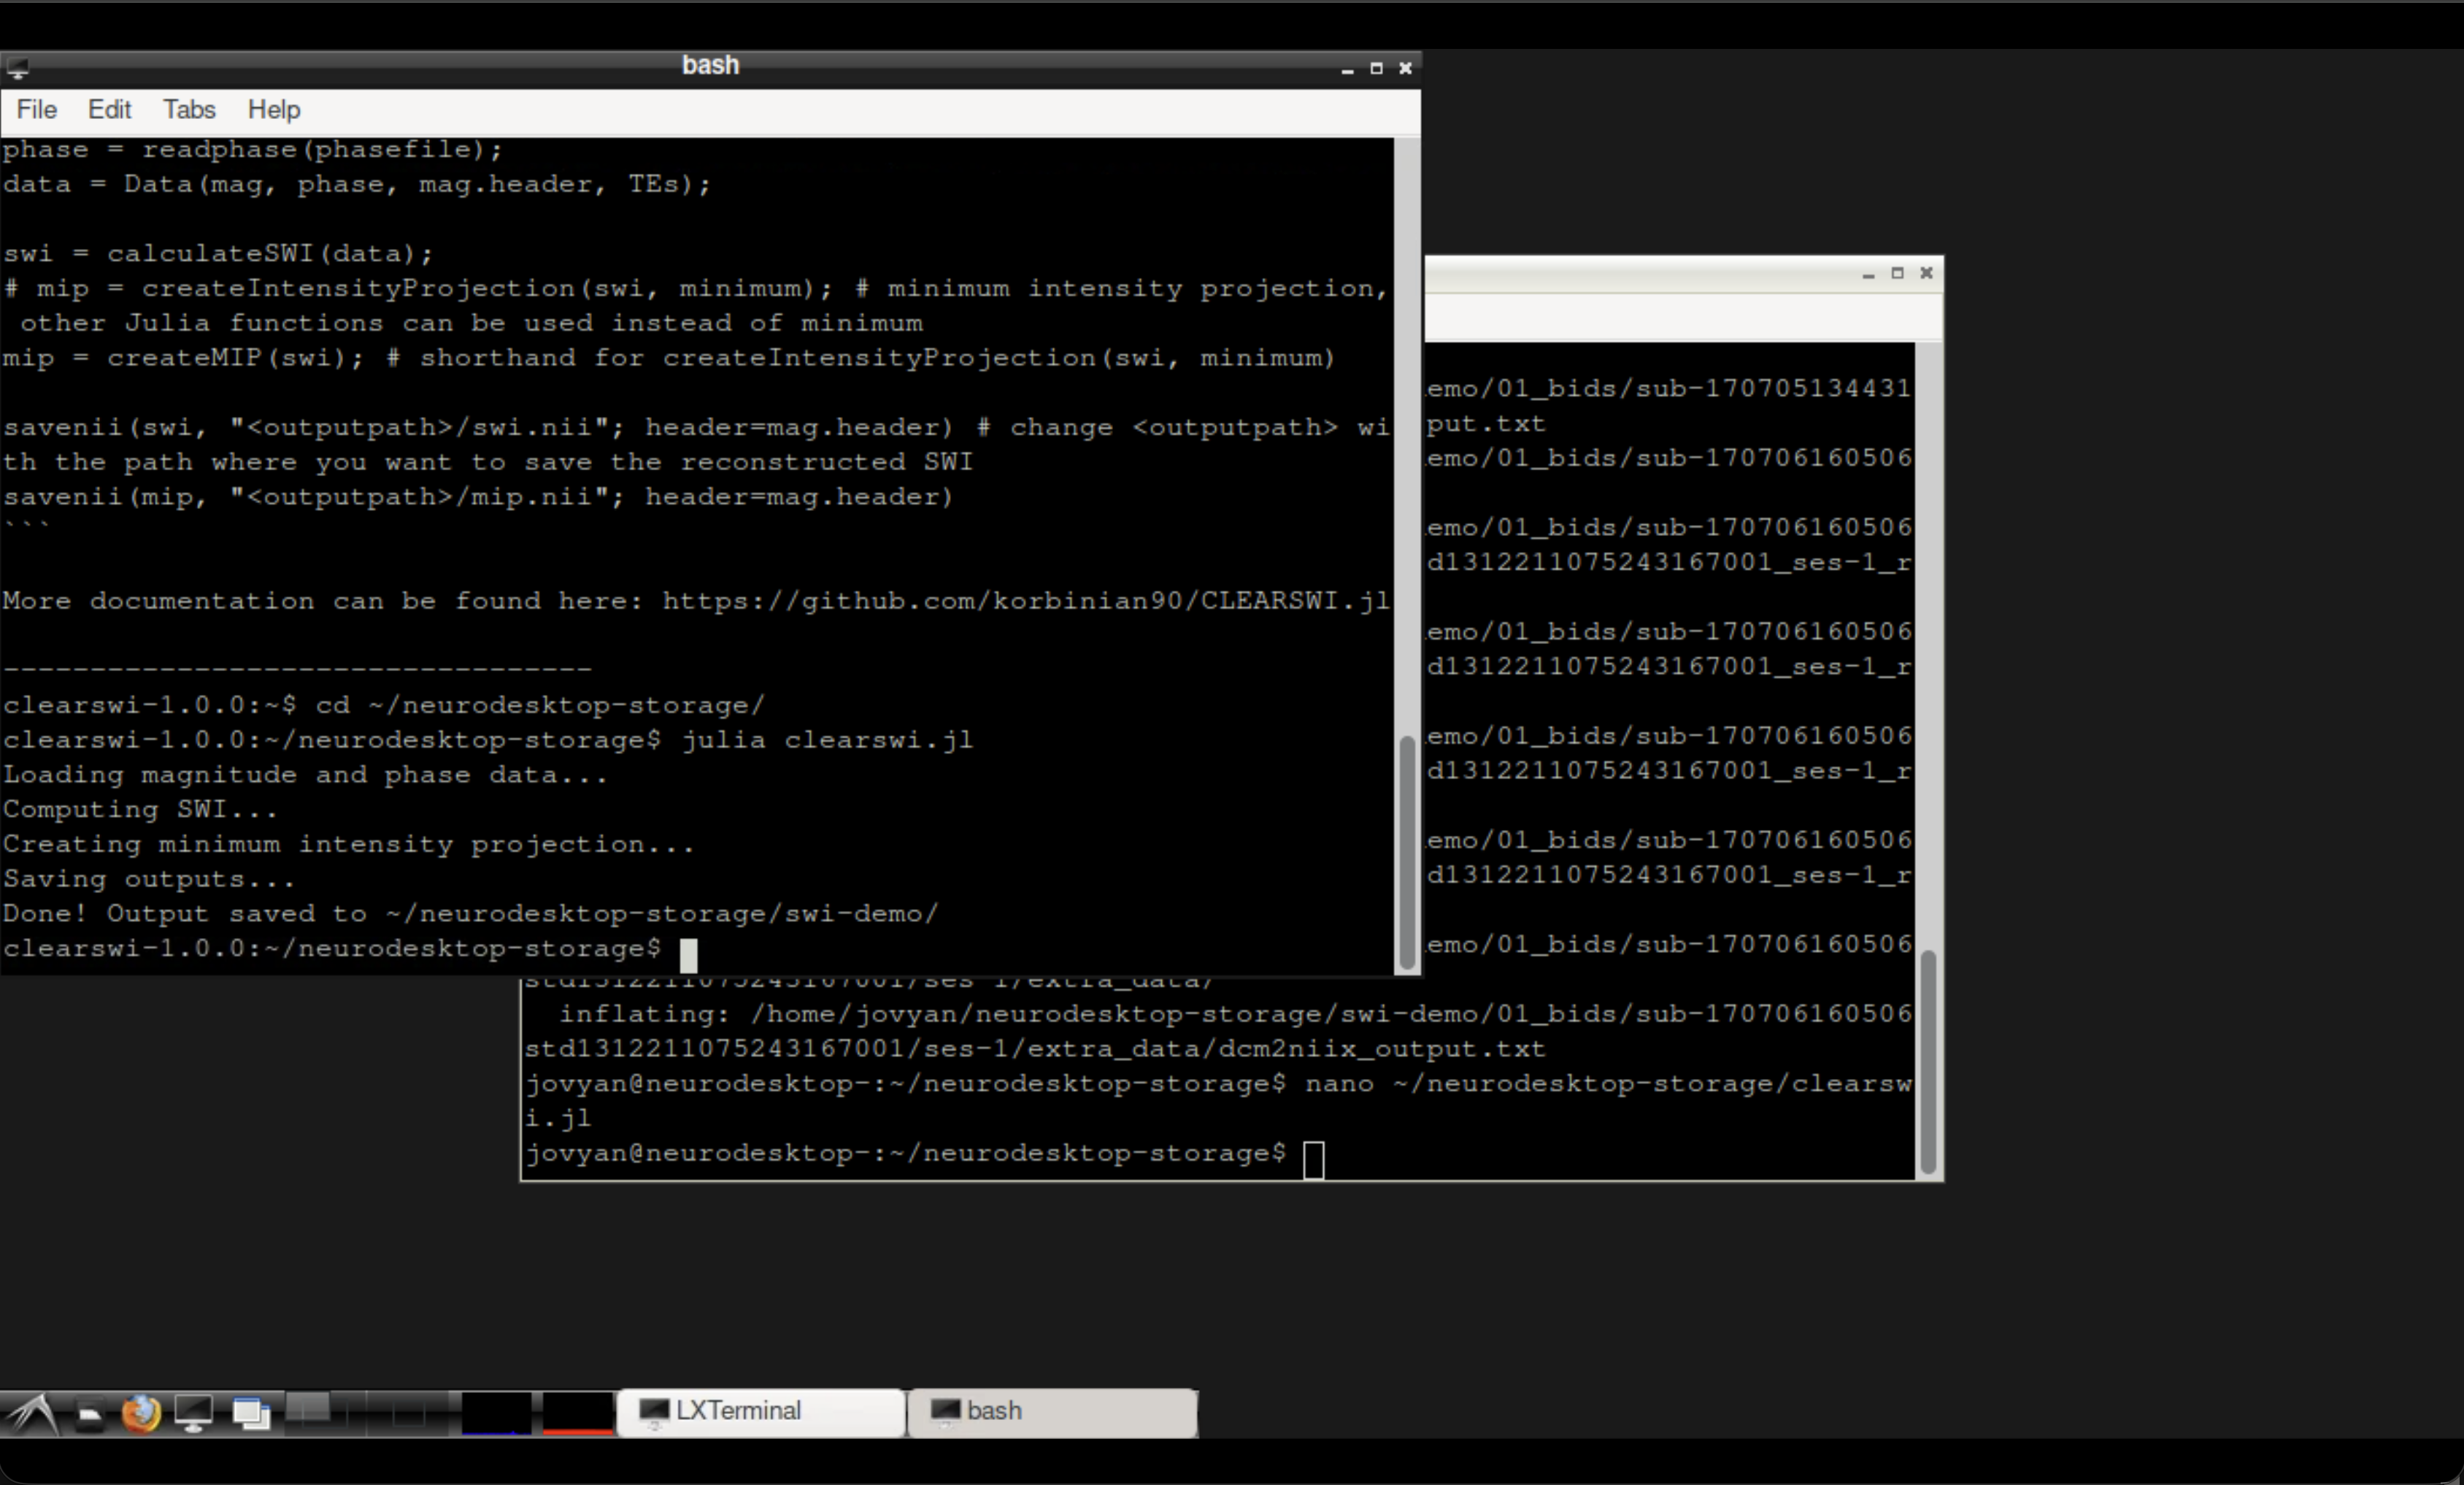 The CLEAR-SWI container terminal after running the script.
Inspect the results#
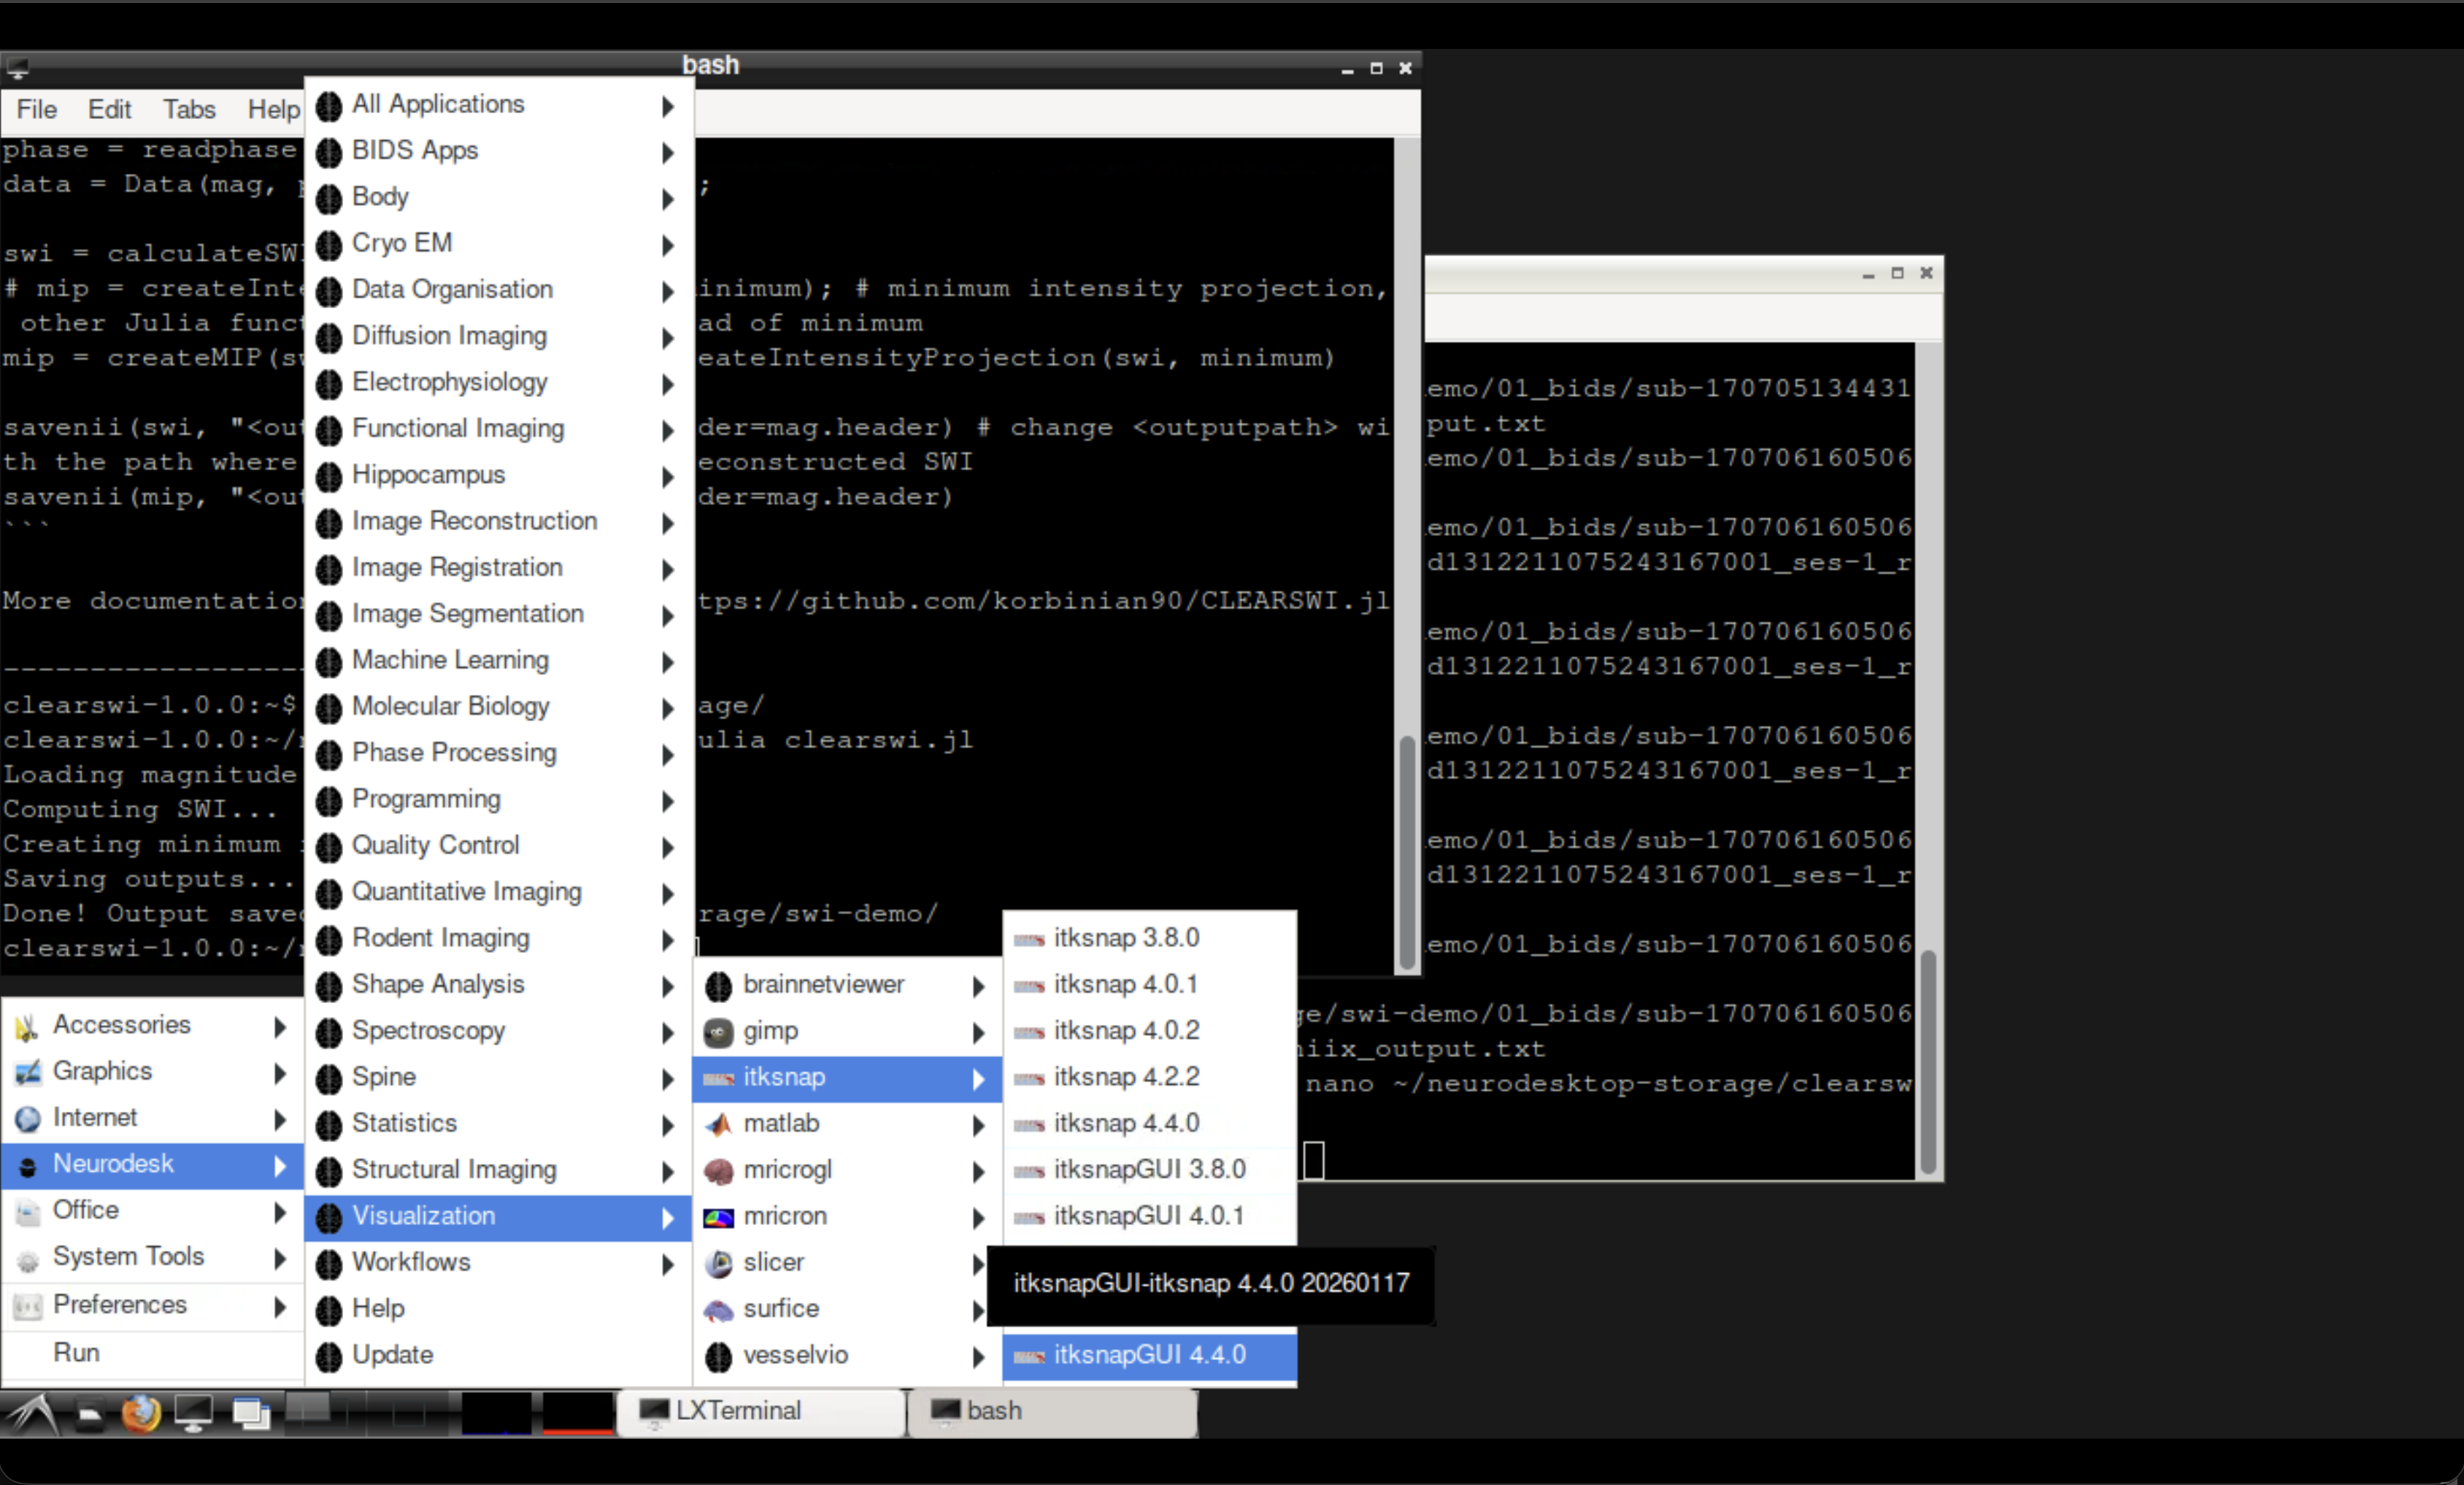
Fig. 2 Opening ITK-SNAP from the Neurodesk Visualisation menu.#
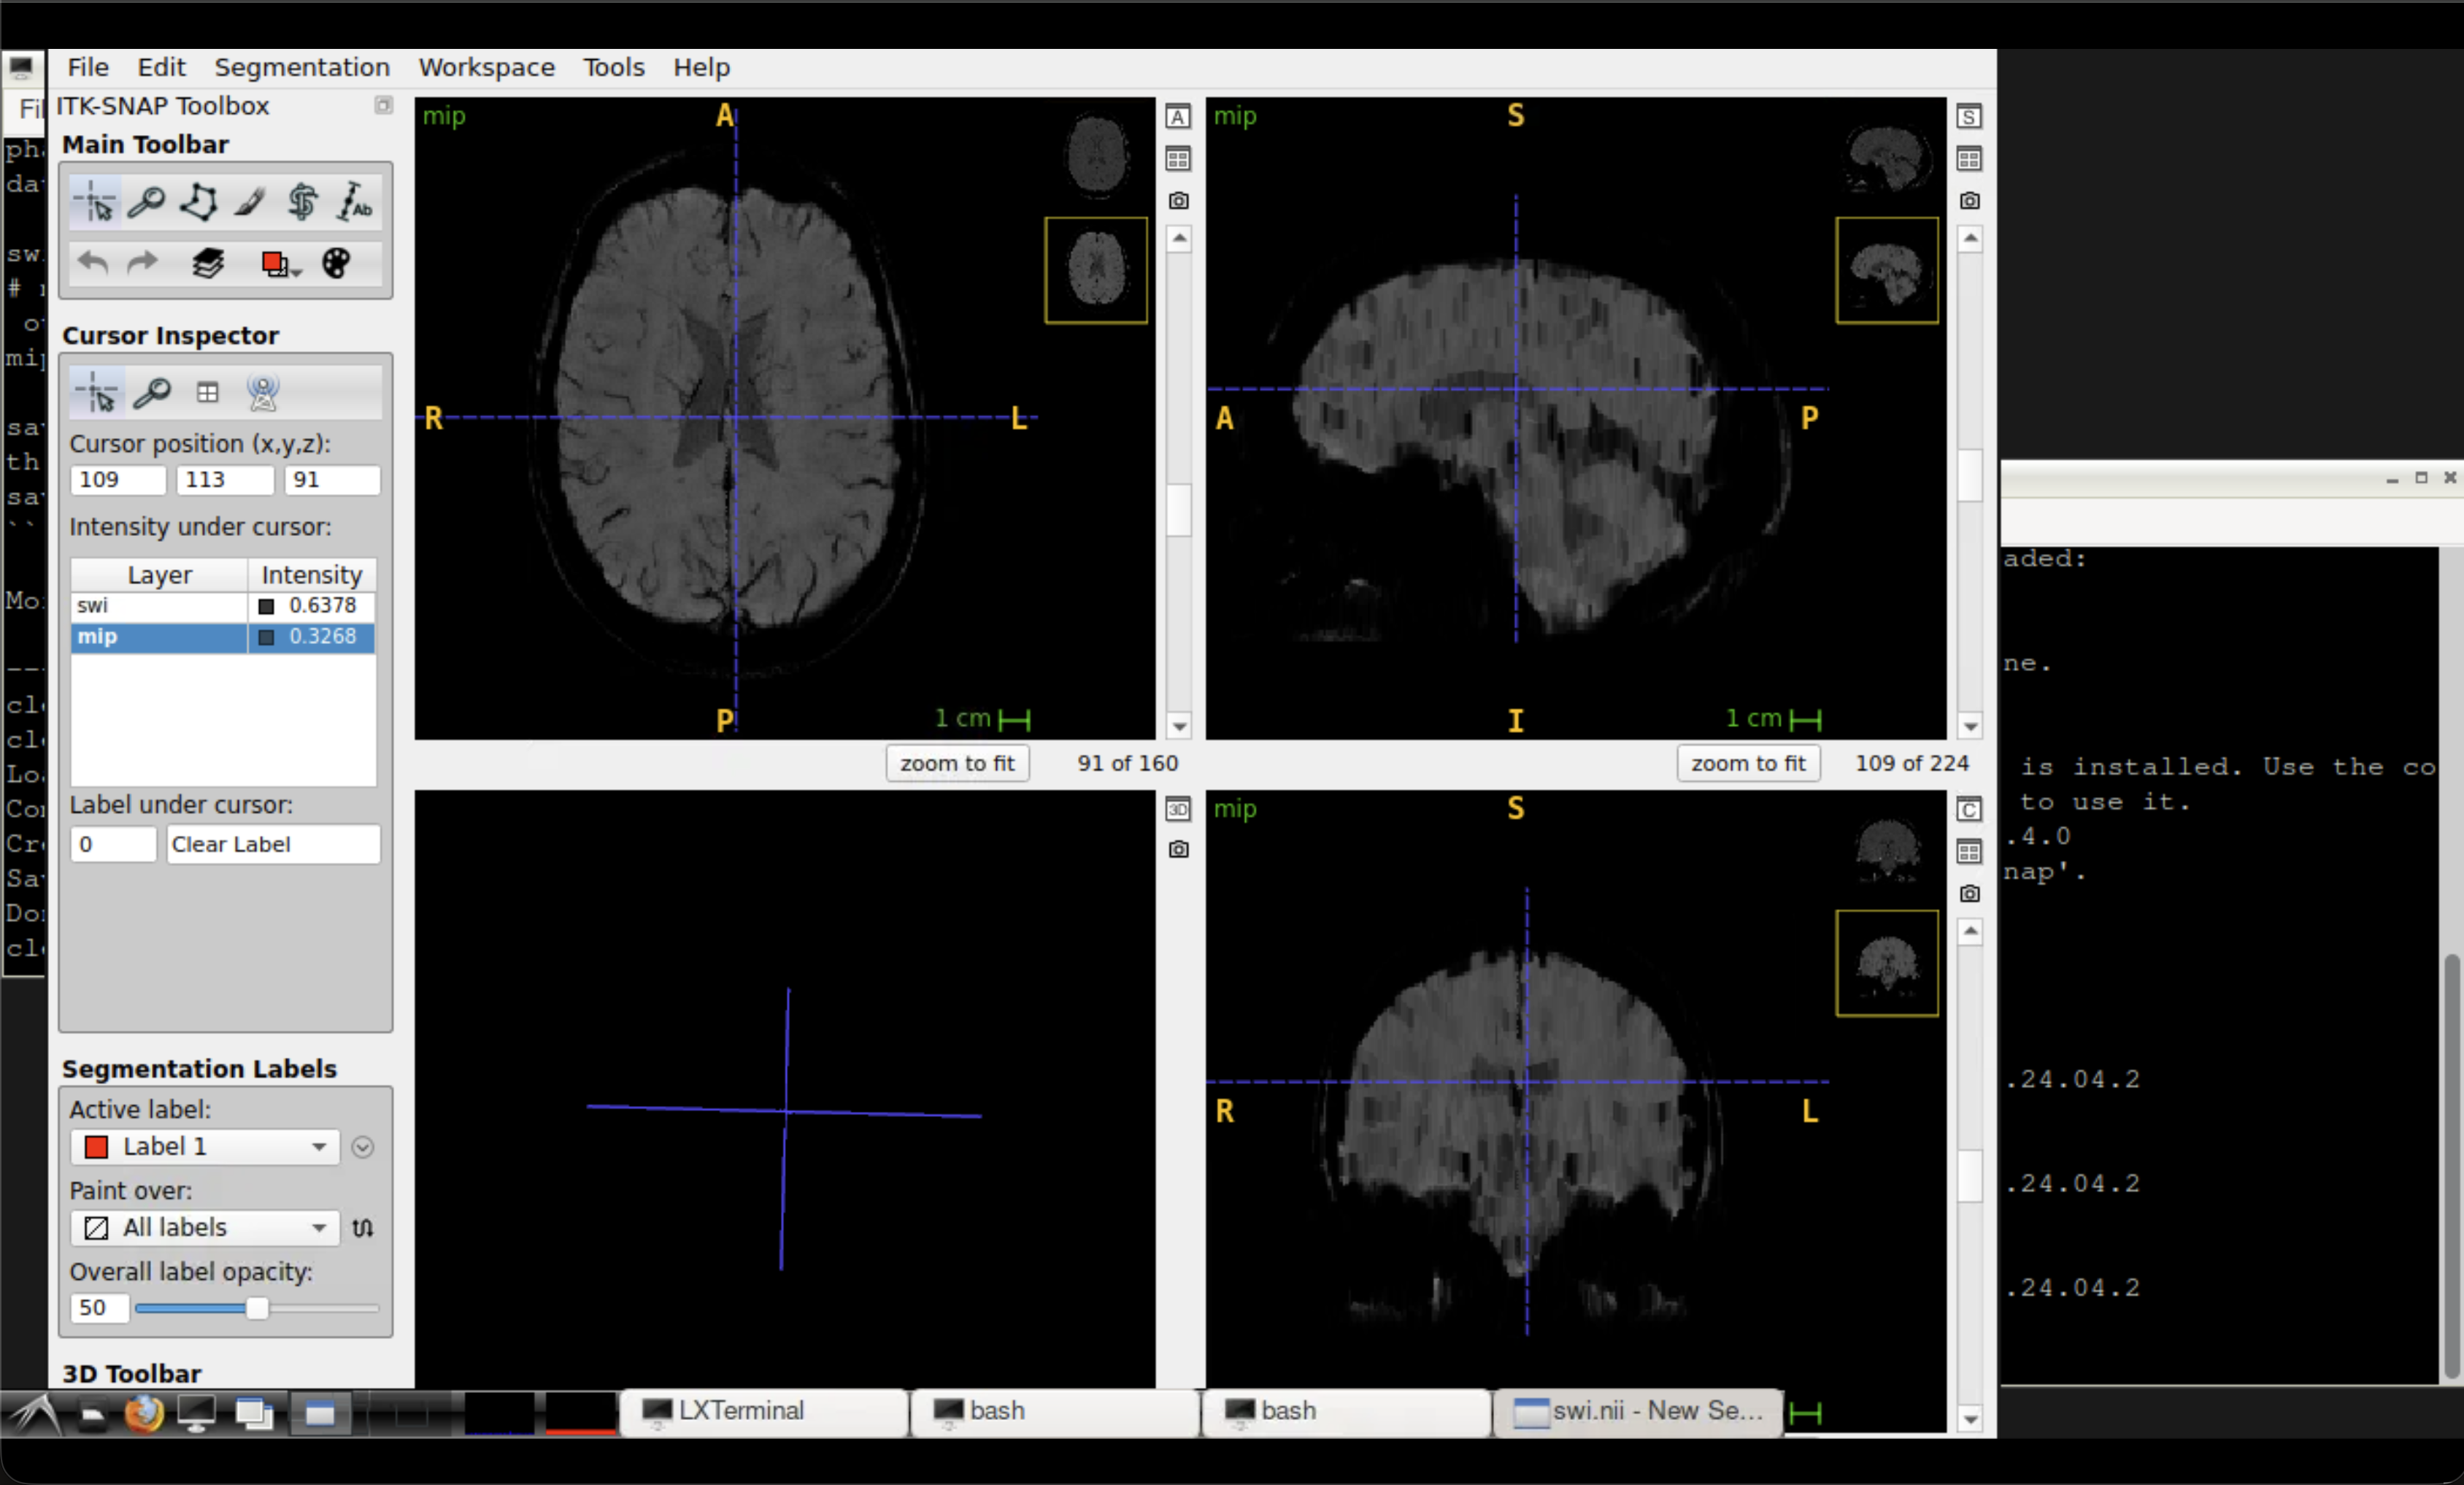
Open ITK-SNAP from the Neurodesk Visualisation menu and load the output files:
~/neurodesktop-storage/swi-demo/swi.nii— the susceptibility-weighted image~/neurodesktop-storage/swi-demo/mip.nii— the minimum intensity projection
Tip
The mIP highlights venous structures as dark lines. Compare the SWI and mIP side by side to appreciate how the projection enhances vein visibility.
Summary#
In this tutorial you:
Downloaded a demo magnitude/phase MRI dataset from the Open Science Framework
Used the CLEAR-SWI Julia package to compute susceptibility-weighted images
Generated a minimum intensity projection for enhanced venous visualisation
Inspected the outputs using ITK-SNAP
See also
Unwrapping tutorial — for unwrapping phase using the same dataset
QSM tutorial — for quantitative susceptibility mapping with QSMxT